


Markets are confused. Rate-hike expectations on the short end have been pushed back to December from September. Yields, however, are rallying on the long end. Just a few weeks ago, Fed Chair Warsh was thanking the bond market for higher yields on the long end; now, Treasury Secretary Bessent wants to scuttle that.
Financial markets are not sure who to believe – Treasury Secretary Scott Bessent or newly appointed Federal Reserve Chairman Kevin Warsh. Bessent wants lower rates on the long end of the treasury yield curve and, to achieve that, is doubling repurchases of longer-dated debt. Warsh, on the other hand, wants to listen to the bond market for signals, which can potentially become a noise if the market is tinkered with.
Last week, the 10-year treasury yield rallied four basis points to 4.74 percent, while the 30-year added a basis point to 5.28 percent, with Tuesday’s intraday high of 5.33 percent the highest since June 2007. The 30-year bonds and 10-year notes were yielding 3.91 percent and 3.60 percent in September 2024, in that order. If the current trajectory in rates is sustained, there will be repercussions across assets.
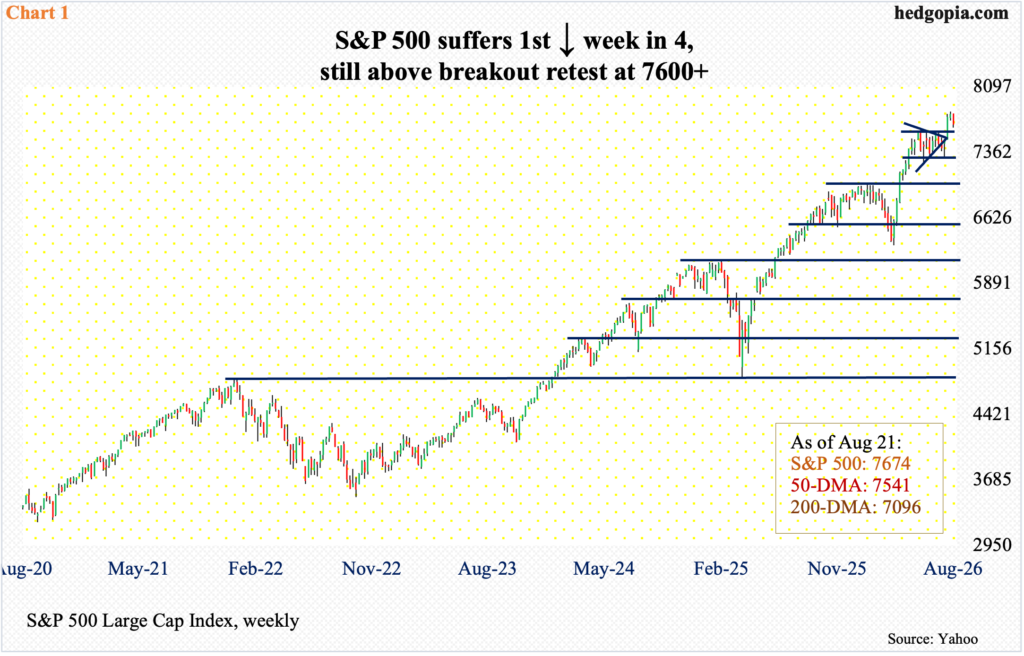
Having just broken out on the 4th this month, when two-month consolidation post-intraday high of 7621 on June 2 resolved with an upside breakout, the S&P 500 last week had its first down week in four, dropping 1.4 percent to 7674. Through that high, the index jumped 23.7 percent from the March 30 low of 6317.
Bulls last week kind of defended that breakout with Thursday’s intraday tag of 7639, followed by strength Friday. The retest was not clean, though. Odds favor a retest soon; 7600-plus is crucial (Chart 1).
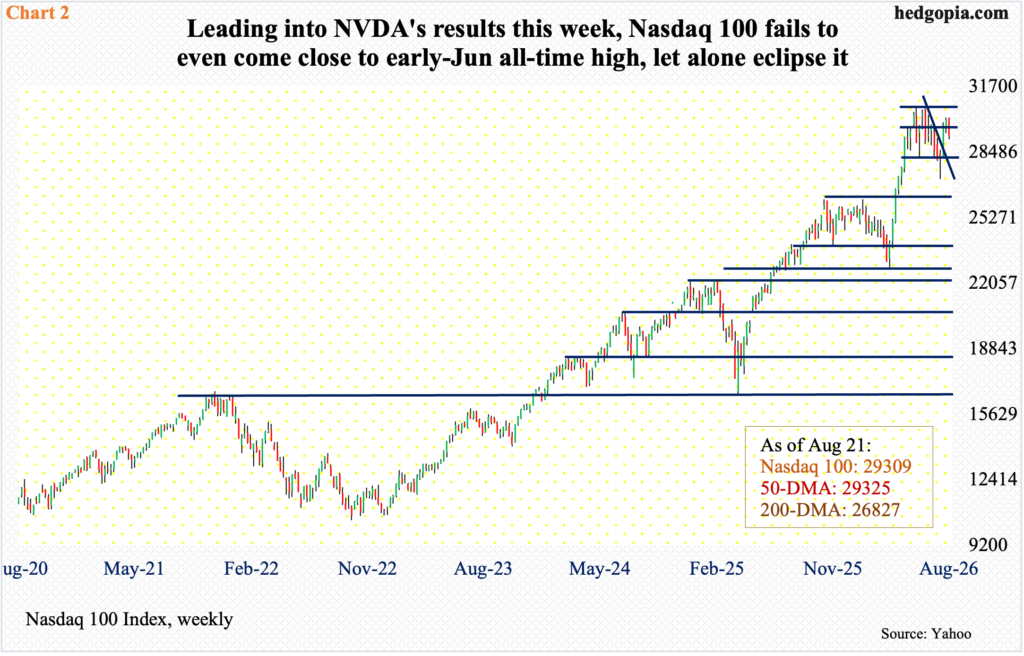
The Nasdaq 100, which had already been lagging its peers, was obviously not spared last week. It gave way 2.5 percent to 29309 – pretty much right on the 50-day (29325).
From the March 30 low of 22841, the Nasdaq 100 surged 34.7 percent through June 3 when it peaked at 30762. Unlike its peers such as the S&P 500 or Russell 2000, which both posted new highs this month, the tech-heavy index never managed to take out that high, with last Monday’s 30196 marking one of a series of lower highs (Chart 2).
On Wednesday, Nvidia (NVDA), which is the largest publicly traded company with a market cap of $5.3 trillion and which accounts for 8.4 percent of QQQ (Invesco QQQ Trust) and 7.9 percent of SPY (SPDR S&P 500 ETF), reports its July quarter, and can move the markets by its sheer size, closing last week at $214.72, barely above crucial horizontal support at $212-$213.
The way the Nasdaq 100 is setting up, it gapped up on the 4th this month, and this will be filled at 28840s, followed by horizontal support at 28200s; after that lies the July 29 intraday low of 27176, which sits just above the 200-day at 26827.
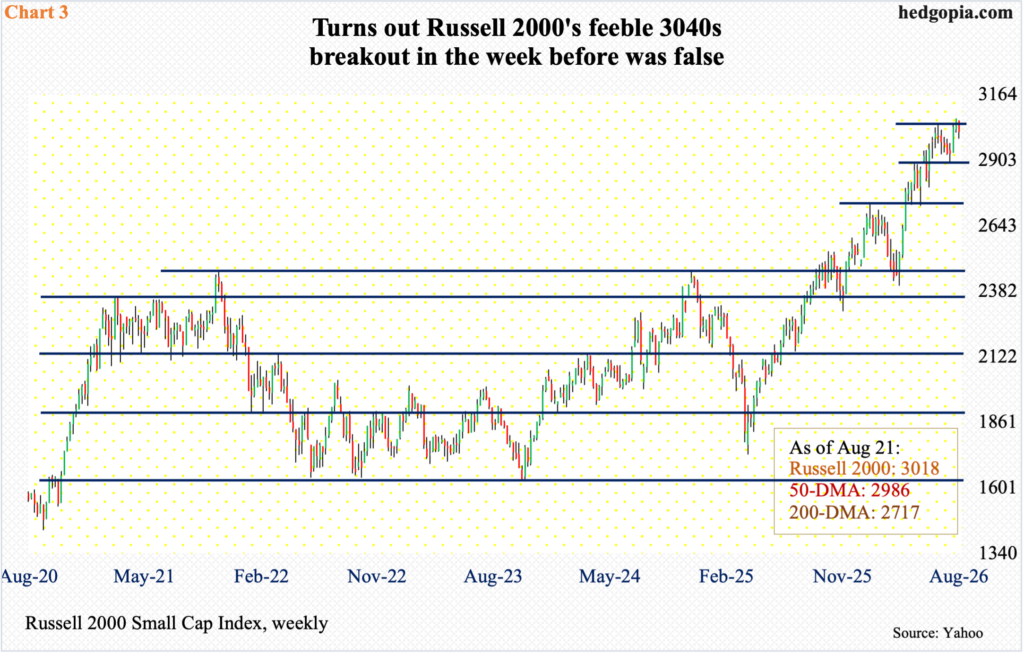
The Russell 2000 last week similarly was unable to save a breakout from the prior week. The breakout at 3040s was hardly decisive to begin with, having only rallied to 3070 by the 14th. Last week, the small cap index declined 1.7 percent to 3018.
Bulls also failed to build on the momentum gained three weeks ago when the index ended a four-week pattern of lower highs after hitting 3047 on July 1; 3040s was again tagged twice early this month.
As things stand, bears have an opening. On its way to posting a fresh intraday high this month, the Russell 2000 had broken through 2940s, which they are now probably eyeing; then comes 2880s (Chart 3).
Small-caps have a higher domestic exposure than their mid- to large-cap cousins that also have international exposure, and they tend to also be leveraged with more exposure to the short end of the curve than the long. In the futures market, traders are betting that the fed funds rate will be raised by a quarter point from the current range of 3.50 percent to 3.75 percent come December; until just a few weeks ago, rates were expected to go up in next month’s FOMC meeting. On the long end, rates are rallying strong.
To rein in the rising bond yields, the Treasury Department last Wednesday announced that it would double its repurchases of longer-dated debt from $2 billion to $4 billion during September 9-November 4; this was followed by Bessent saying on Thursday that he may increase the buybacks further.
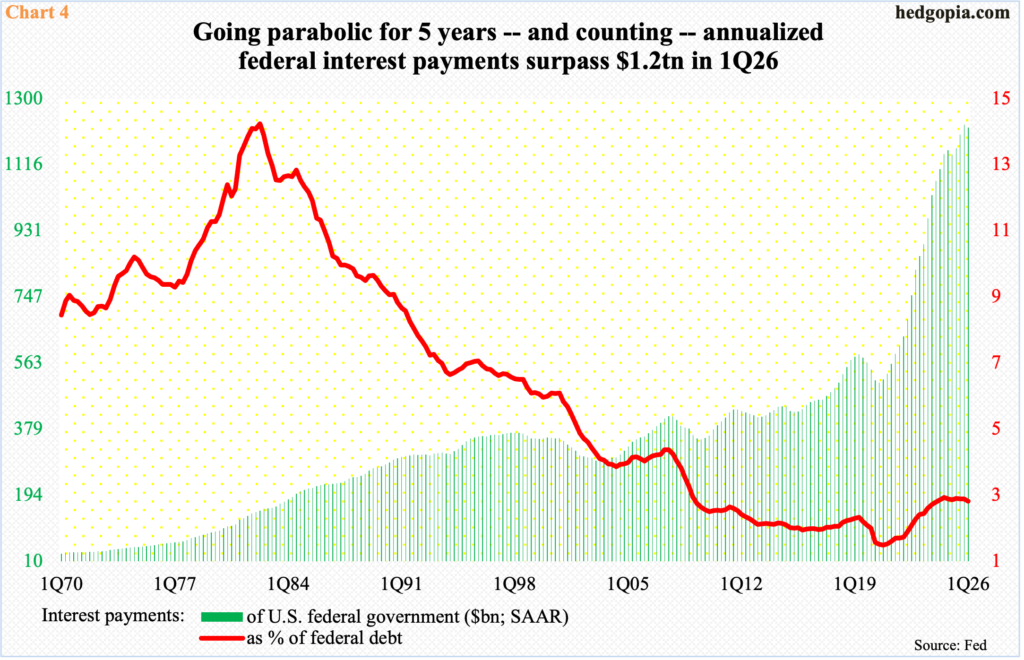
Bessent has a reason to panic. In the March quarter, annualized federal interest payments were $1.22 trillion, just under the record $1.23 trillion sequentially. Interest cost has doubled in four years. As a percent of the national debt, which crossed $40 trillion last week, 1Q26 interest payments made up 3.12 percent.
The red line in Chart 4 can essentially be viewed as an effective interest rate, which has slightly trended lower since the 3Q24 high of 3.23 percent. Bessent would want this trend to continue, but the bond market is not cooperating.
It is the way for the so-called bond vigilantes to communicate to the U.S. government to get its profligate house in order.
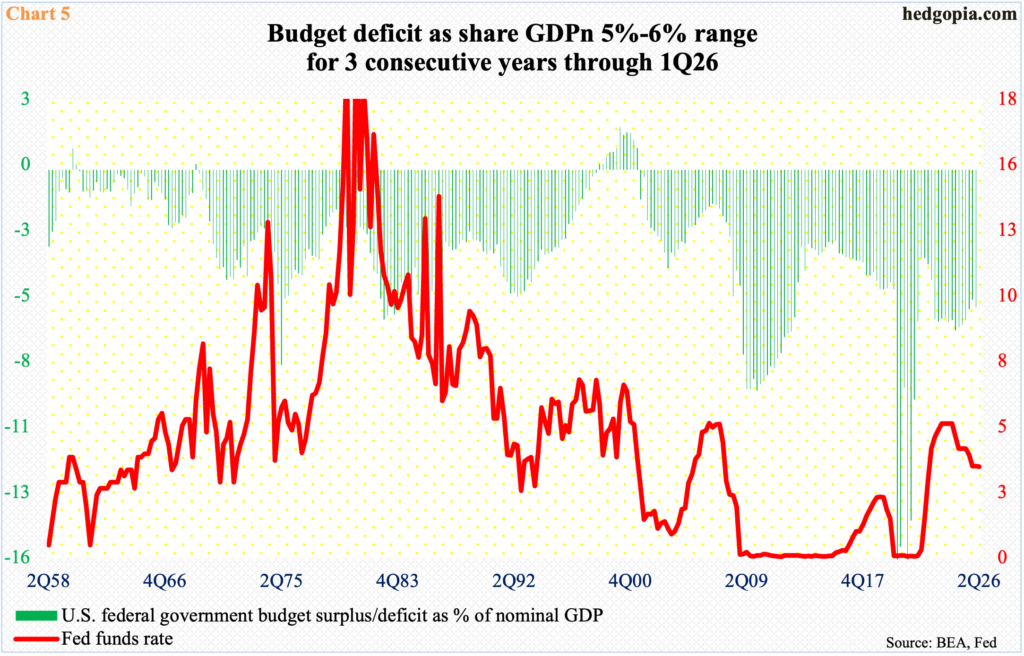
In the 12 months to July, the budget deficit of the U.S. government totaled $1.95 trillion. On a quarterly basis, the red ink was $1.81 trillion in the June quarter, accounting for 5.7 percent of nominal GDP at $31.9 trillion. Deficit’s share of GDPn has consistently remained in the five percent to six percent range for three years now (Chart 5).
This kind of spending is insane considering that the economy is in expansion mode, not contraction when revenues fall and spending increases. The bond market would prefer Bessent addresses this problem than try to manipulate long rates lower by buying more bonds.
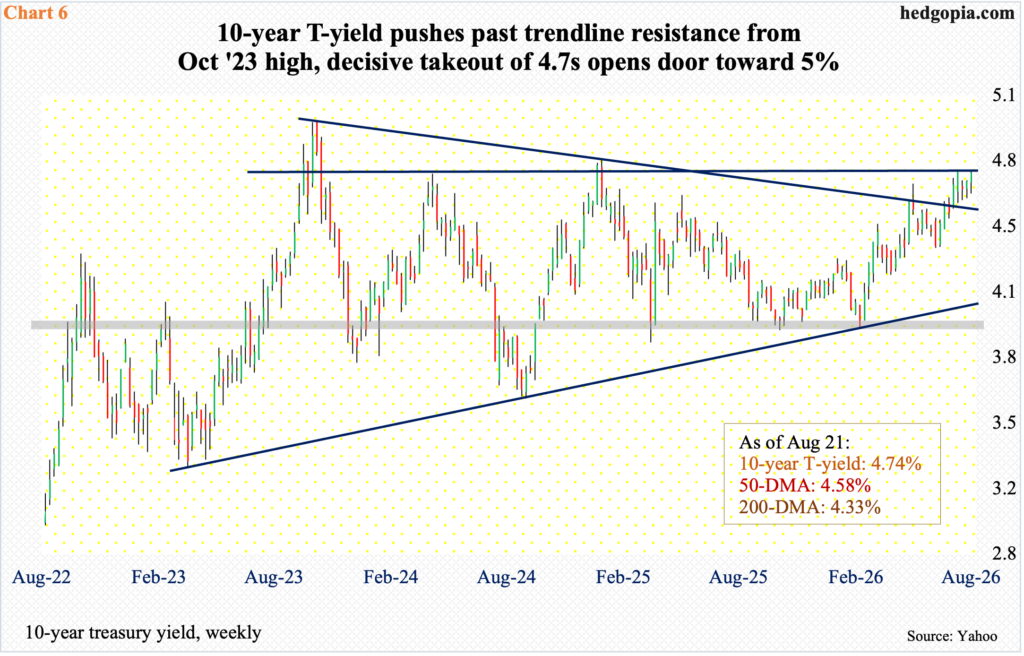
As explained earlier, long rates have been rallying. The 10-year T-yield has not quite hit a nearly two-decade high as did the 30-year, but it is sitting at a crucial juncture.
The 4.75 percent tagged intraday on July 31 was the highest since January last year, with resistance at 4.7s going back three years. The 10-year closed last week right at this hurdle. Leading up to this, bond bears (yield and price are inversely related) finally took care of trendline resistance from October 2023 when yields peaked at five percent (Chart 6). In the event 4.7s give way, five percent can quickly act as a magnet.
Even if 4.7s cave in but not the five percent, heightened nerves will probably reverberate across assets, not the least of which are equities.

Comments
Log in or sign up to join the conversation.