

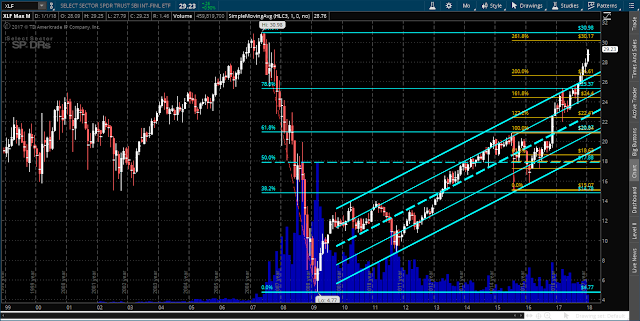
The following Monthly chart of the Financial Sector (XLF) shows that it has been on a strong rally since mid-2017. It's approaching major resistance around the 30.00-31.00 level (prior all-time high and double Fibonacci retracement levels).
The following Monthly chartgrid of XLF and five of the major U.S. bank stocks (GS, C, JPM, BAC & MS) shows, at a glance, which of these stocks has, either, outperformed and made a new all-time high, or, underperformed XLF.

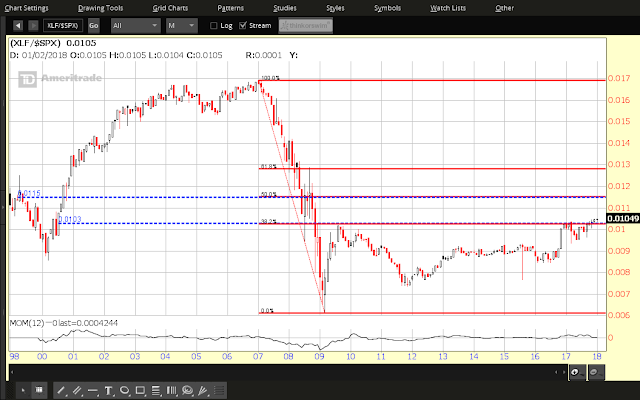
The following Monthly ratio chart of XLF:SPX shows that price broke out above its first major resistance level of 0.0103 (confluence of price and its 40% Fibonacci retracement level) at the end of 2017.
The next major resistance is around 0.0115 (confluence of price and its 50% Fibonacci retracement level).
Given what I said in my post of January 12 ("...the SPX may see some whip-saw action in the coming days/weeks..."), XLF may continue to outperform the SPX for, potentially, some time -- perhaps the first couple of quarters this year -- until we see further clarity of the Fed's intentions (short and longer term) regarding interest rate increases, as well as further developments in the November U.S. mid-term Congressional election, by the third quarter.
If so, keep an eye on whether:
- XLF can continue its push to spike through, and hold above, 31.00,
- GS and JPM continue to maintain their upward momentum,
- C, BAC, and MS can strengthen their upward climb (all three have a long way to go to reach their prior all-time highs), and
- the XLF:SPX ratio can hold above 0.0103 and climb higher

Comments
Log in or sign up to join the conversation.