
The S&P 500 index is on a tear! This is the most hated bull market in history. Pundits have often voiced concerns that the rally lacks fundamental basis. Chart experts repeatedly point to overbought conditions.
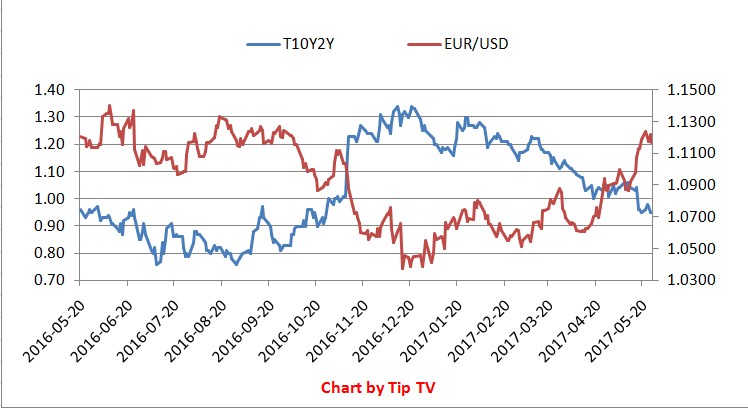
However, the market does not budge! The fact that the stock markets do not like rising interest rates/bond yields has been put to rest as well. Both bond yields and S&P 500 are rallying hand-in-hand since Q3 2016. Trump victory only added to the bullish momentum in yields and stocks.
The question asked across the globe is… how high can the S&P 500 fly? Both technically and fundamentally we are in the uncharted territory. No one really knows if Trump would deliver on his pre election promises.
Drawing parallels between 1998-2000 & 2016-2017
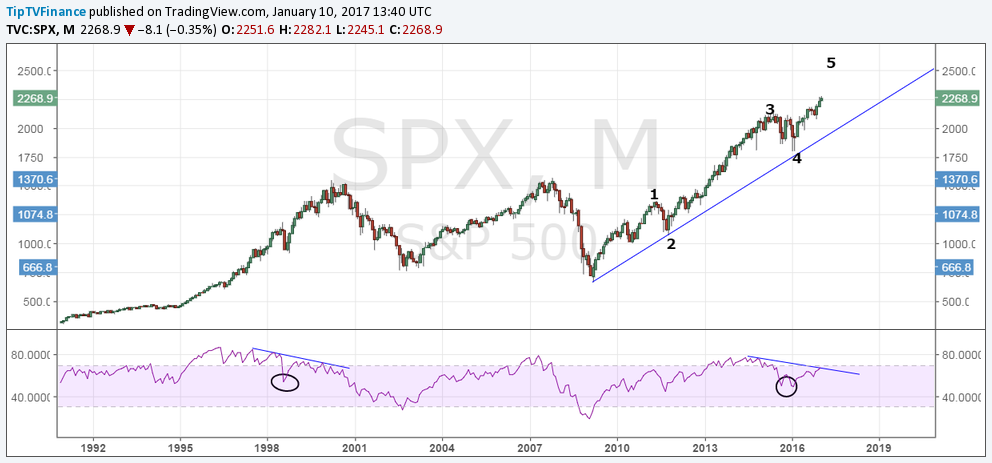
Monthly chart
(Click on image to enlarge)
Some observations
- The overbought RSI alone does not suggest a top is in place. Repeated bearish divergence as noticed in the late 1990 is a sign the index is poised for a major correction.
- The bearish divergence preceded the crash of 2008 as well.
- The current rally from the 2008 low looks like a classic 5-wave structure. The rally from 2016 lows could be the 5th wave higher.
Monthly RSI – Going the 1999 way
The drop in the S&P 500 index and the RSI in August 1998 is similar to the dip we saw in Jan/Feb 2016.
In both cases, the drop was preceded by falling tops formation on the RSI and rising bottoms on the price chart.
Charting the uncharted territory with RSI
Following the dip in August 1998, the index began a fresh rally that ended at a high of 1553.1 in March 2000. During the same time frame, the RSI continued to diverge.
The rally from August 1998 low to March 2000 (17 months) was approximately 62%.
On similar lines, a 62% rally from Jan/Feb 2016 lows suggests potential for a rally to 2935 levels. The index could rise to 2935 levels by Q3 2017) (17 months).
S&P 500 – 2500 could be a done deal
As said earlier, the rally from 2009 low looks like a classic 5-wave structure. If we zoom-in on the rally via weekly chart, the third wave could easily be an extended one.
As per Elliot wave theory, when the third wave is extended the 5th wave is approximately equal to the 1st wave. The 1st wave amounted to 703.8 points. That means the 5th wave, which began from Feb 2016 low could rise to 2514 levels.
Another parallel that could be drawn is – Fed tightening cycle. The Fed rate hike cycle began in July 1999 and ended in July 2000. Moreover, the rate hikes were part of the tightening cycle that was set in motion in mid-1997. The Fed was forced to stall due to Russian default and Asian crisis.
On similar lines, we had Asian currency slide in 2013 on Taper tantrum followed by Russia crisis in 2014 and now the Fed is expected to hike rates at a faster rate in 2017.
To conclude
The above discussion only takes into account the common points between 1999/2000 and 2016/2017. By no means is it a signal that the index is set to crash in Q3 2017. However, there are just too many parallels/common points that couldn’t be ignored.
_636324431350288293.png)
Comments
Log in or sign up to join the conversation.