

Apple (AAPL) shares stunned the market on 17 February warning they will miss their revenue targets in the second quarter due to the impact of the coronavirus. The iPhone maker's share price dropped nearly 2% when markets opened for trading the next day. With the share price already up 10% for the year already (at the time of writing), we discuss the trading opportunities happening right now.

Apple's coronavirus-related sales warning
On Monday 17 February, Apple said that it does not expect to meet its second-quarter revenue forecast because of lower iPhone supply around the world, as well as lower Chinese demand due to the coronavirus outbreak.
Most of Apple's products are made in China. The coronavirus outbreak has led to the closure of Apple stores and manufacturing plants of its suppliers. Even though the country extended the Lunar New Year holiday, resulting in all iPhone manufacturing facilities reopening, Apple still expects shortages globally.
It's a big deal for Apple, as China accounts for around 15% of its overall revenue. The situation has led some analysts to cut price targets on Apple stock. Barclays reduced its price target from $304 to $297 which represents some significant downside from the opening price on Tuesday 18 February of $315.
While these may cause investors to think twice about buying at current levels it is worthwhile remembering that much of Apple's recent stock price rise is due to the company diversifying its business into growing services and wearables. So while the long-term fundamentals are still in tact, any weakness from further spreading of the coronavirus may be 'dip-buying' opportunities. Let's take a look at the charts.
How to Trade Apple
Below is the long-term, monthly price chart of Apple's share price:
(Click on image to enlarge)
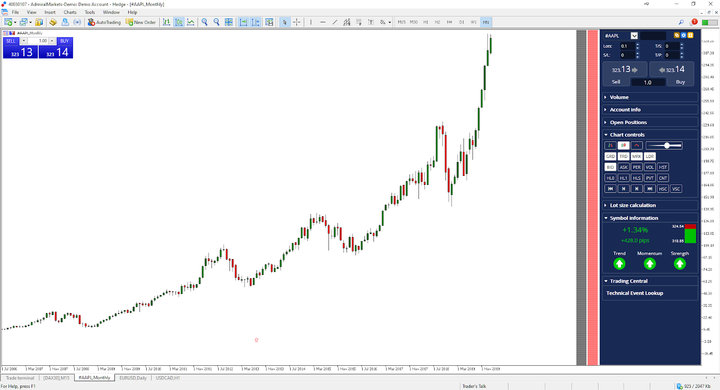
Source: Admiral Markets MetaTrader 5 SE, AAPL, Monthly - Data range: from 1 July 2006 to 20 February 2020, accessed on 20 February 2020 at 10:15 am GMT. Please note: Past performance is not a reliable indicator of future results.
With Admiral Markets you can speculate on the price direction of Apple's share price by using a CFD (Contract for Difference). This allows traders to go long and short on the market, using leverage. You can learn more about leverage in the 'What is Leverage in Forex Trading?' article.
While the monthly chart above shows a clear trend higher, the lower time frame daily chart pattern is showing a price consolidation, known as a wedge pattern, as shown below:
(Click on image to enlarge)
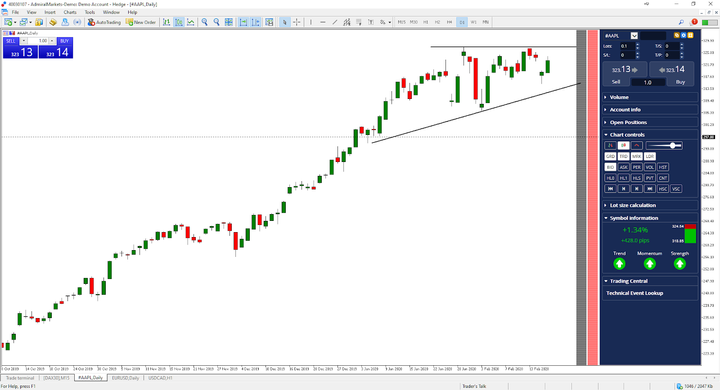
Source: Admiral Markets MetaTrader 5, AAPL, Daily - Data range: from 8 October 2019 to 20 February 2020, accessed on 20 February 2020 at 10:45 am GMT. Please note: Past performance is not a reliable indicator of future results.
The recent consolidation in Apple's share price is highlighted between the two black lines in the chart above. This type of chart pattern is known as an ascending triangle formation or wedge pattern. It is known as a bullish chart pattern as the market makes a series of swing higher low cycle formations before breaking through an identifiable horizontal resistance line.
The question now for traders is which way Apple's share price is going to break. Until it breaks outside of the consolidation pattern traders should be careful with targeting as price trades sideways. There are mixed signals among analysts with some having lower and higher price targets from where price is. This means that price action will be the most important factor in making trading decisions while still in this consolidation.
However, the ascending triangle pattern is a well-known chart pattern which suggests further upside is likely, provided price can break above the horizontal resistance line. If this does occur, many traders would then work their way through the lower time frames such as the daily, four-hour, one-hour and thirty-minute chart to find suitable long, or buy entries.
Finding price levels on where to enter and exit and how to risk manage the trade are dependent on the type of trading strategy used by individual traders and the indicators used for technical analysis. For example, on the four-hour chart below, Apple's share price has continue to push higher, as long as the 20-period exponential moving average (blue line) is above the 50-period exponential moving average (red line). This combination of identifying a fast moving average trading above a slow moving average is very common among discretionary and algorithmic traders.
(Click on image to enlarge)
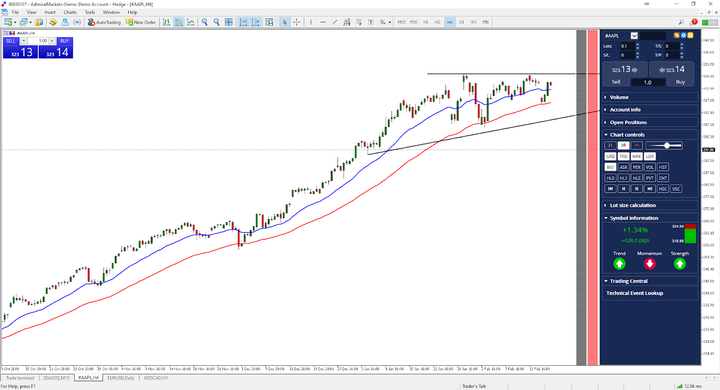
Source: Admiral Markets MetaTrader 5, AAPL, H4 - Data range: from 9 October 2019 to 20 February 2020, accessed on 20 February 2020 at 10:55 am GMT. Please note: Past performance is not a reliable indicator of future results.



Comments
Log in or sign up to join the conversation.