

Rising stock market volatility has made for a very tough trading environment for investors.
And while stocks remain elevated, several key indexes and indicators are flashing caution.
Last week, I highlighted an important tech stocks ratio that is teetering. And today, we focus on the broader stock market via the S&P 500 Index.
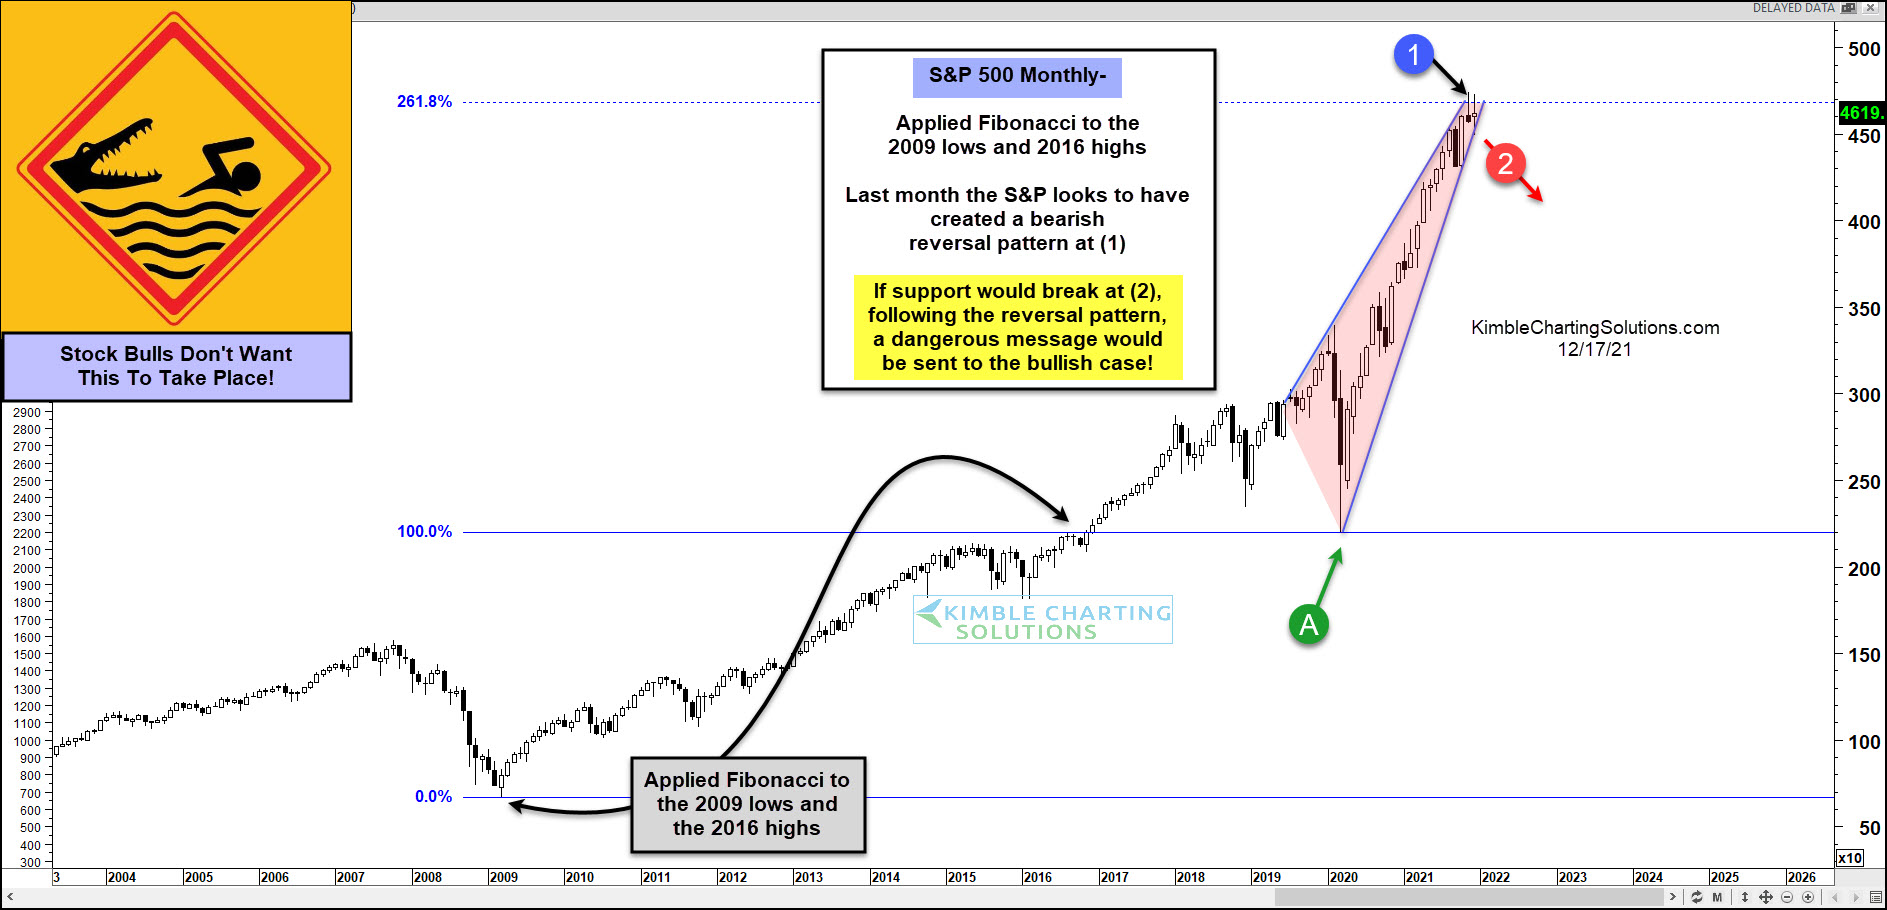
On the “monthly” chart of the S&P 500, one can easily see the sharp move higher off the coronavirus crash low at (A). The move has been so steep that the up-trend has little room for error here… and the pattern of the move has taken the shape of a bearish rising wedge pattern. As you can see, the pattern is narrowing and price will squeeze one way or the other soon.
More importantly, and of concern, is that the S&P 500 created a bearish reversal pattern last month at (1). And this occurred right at the 261.8 Fibonacci extension level. Not only does this create strong overhead resistance, but it also adds to concerns surrounding this rising wedge pattern.
If support would break at (2), following this reversal pattern, a dangerous message would be sent to investors. In short, stock market bulls don’t want to see this take place!
A breakout above the 261% level at (1).
(Click on image to enlarge)



Comments
Log in or sign up to join the conversation.