


Solana SOL is back in the green after a bearish weekend, with the cryptocurrency now trading at $71 after falling to $67, its lowest level since late June.
The cryptocurrency continues to struggle as institutional demand weakens, with US spot Solana exchange-traded funds (ETFs) recording their sixth consecutive week of net withdrawals.
The continued withdrawals have coincided with a broader deterioration in Solana's technical outlook. SOL remains significantly below its major moving averages and a previously supportive ascending trendline.
Solana ETFs record six consecutive weeks of outflows
Institutional demand for Solana has continued to weaken, with spot ETFs experiencing persistent withdrawals since October.
According to SoSoValue, US spot Solana ETFs recorded $32.05 million in net outflows last week.
The withdrawals marked the sixth consecutive week of negative net flows, suggesting a sustained reduction in investor exposure through regulated investment products.
If the outflow trend persists this week, it could contribute to additional selling pressure and make it more difficult for SOL to establish a sustained recovery.
A sustained return to positive ETF inflows would provide stronger evidence that institutional confidence is beginning to improve. Until then, Solana's recovery could remain vulnerable to renewed selling.
Solana falls to a four-month low as bearish trend persists
Solana's latest decline pushed its price to $67.41, its lowest level in approximately four months.
Although SOL subsequently recovered to around $71.02 on Monday, the rebound has done little to change its broader bearish technical structure.
Solana continues to trade well below its major daily Exponential Moving Averages. The 50-day EMA stands near $94.62, while the 100-day EMA is positioned around $95.80.
Meanwhile, the 200-day EMA sits at approximately $96.14. These moving averages form a concentrated resistance zone that could limit recovery attempts.
Solana has also broken below a previously supportive ascending trendline, which now acts as resistance around $91.06.
The breakdown indicates that the cryptocurrency has lost an important technical structure that previously supported higher prices.
Despite the prevailing bearish outlook, Solana's momentum indicators suggest that the recent decline may be becoming overstretched.
The daily Relative Strength Index (RSI) stands near 20, placing SOL deep in oversold territory.
An RSI reading below 30 generally indicates that selling pressure has become excessive relative to recent price movements.
Meanwhile, Solana's Moving Average Convergence Divergence (MACD) indicator remains in negative territory.
The negative MACD reading suggests that bearish momentum continues to dominate despite the possibility of a short-term rebound.
The combination of deeply oversold RSI conditions and negative MACD readings presents a mixed near-term outlook.
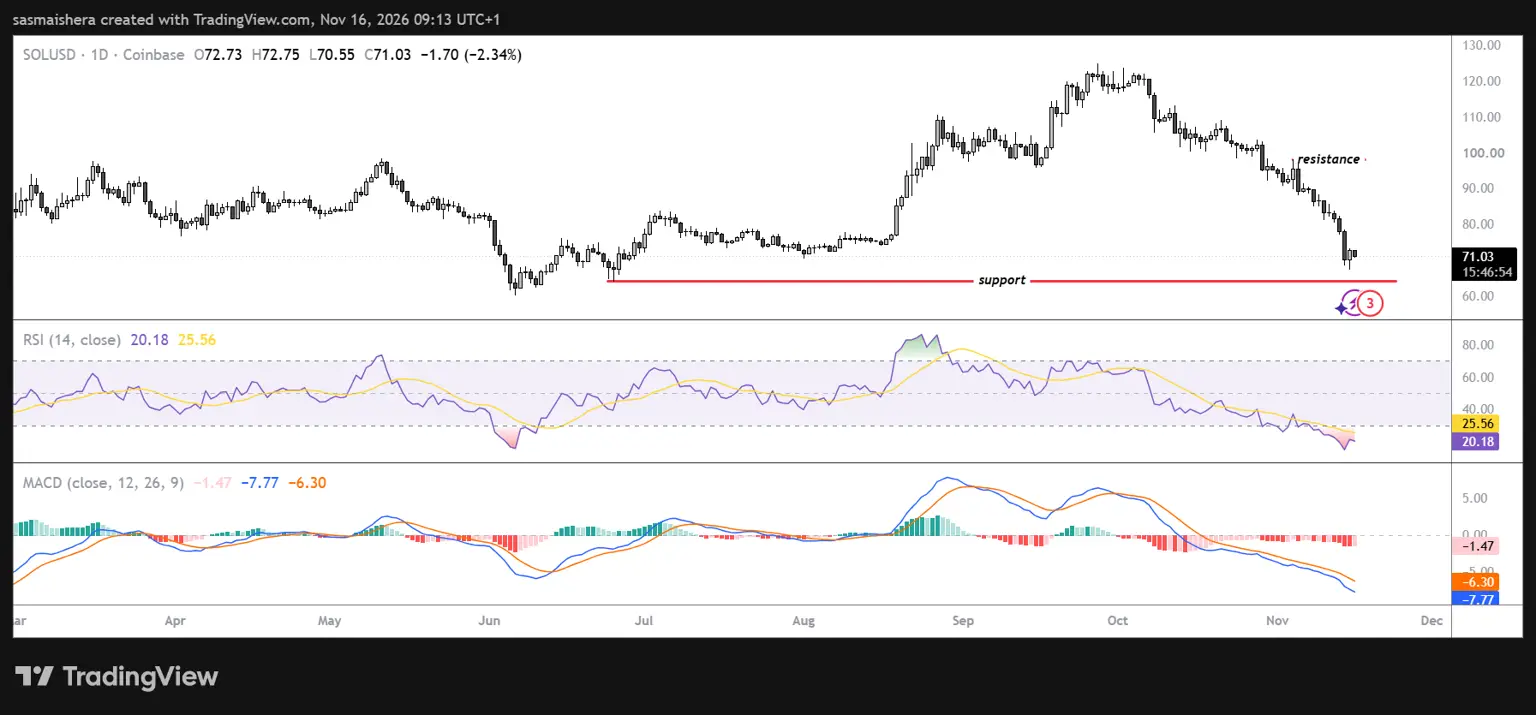
While a temporary recovery is possible, the broader technical structure remains bearish. A successful defense of $67.41 could encourage buyers to establish positions and potentially support a period of consolidation.
However, a sustained breakdown below the recent low would weaken the technical outlook further.
The absence of clear technical support below $67.41 increases uncertainty about where buyers might return.
On the upside, Solana faces immediate resistance at $78.35. A sustained move above this horizontal resistance would suggest that buyers are regaining some short-term control.
However, SOL would still need to overcome the former ascending trendline near $91.06. Reclaiming this level would represent a more meaningful technical improvement, potentially signaling that the recent breakdown is losing momentum.
Beyond $91.06, Solana faces a dense resistance cluster formed by its major daily EMAs. The 50-day EMA stands at $94.62, followed by the 100-day EMA at $95.80 and the 200-day EMA at $96.14.
A breakout above this zone could encourage buyers to target the horizontal resistance near $97.77.



Comments
Log in or sign up to join the conversation.