
Although the price of black gold increased a bit on Friday, the commodity closed the whole week below important resistance lines and invalidated earlier breakouts. What does it mean for crude oil?
Crude Oil’s Technical Picture
Let’s take a closer look at the charts below and find out (charts courtesy of http://stockcharts.com).
(Click on image to enlarge)
On Friday, we wrote the following:
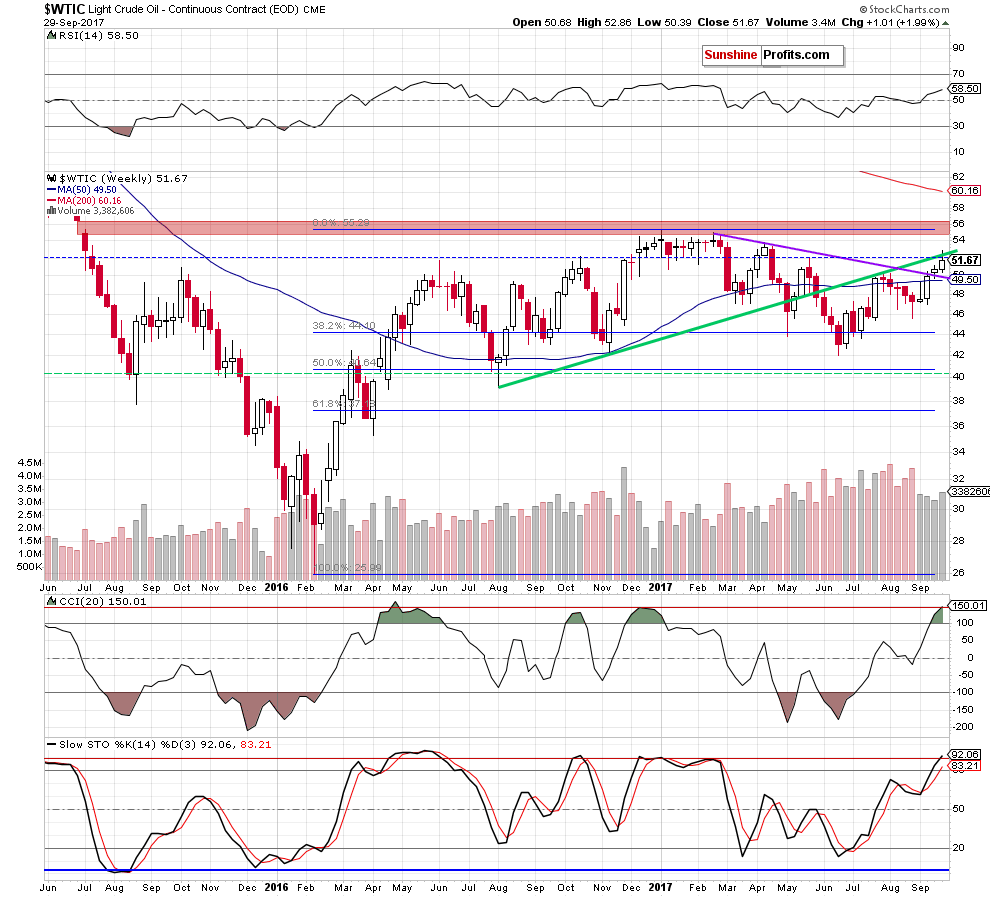
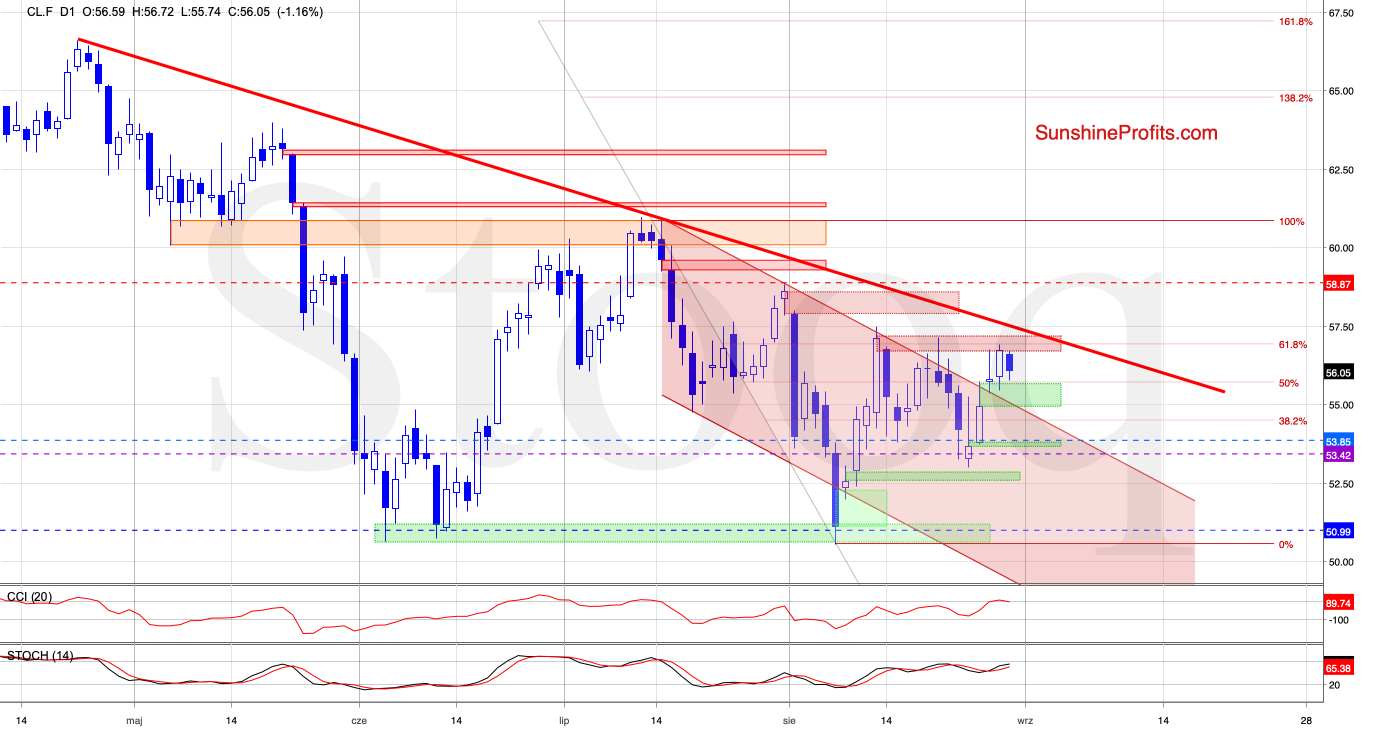
The first thing that catches the eye on the medium-term chart is an invalidation of the breakout above the long-term green resistance line. Additionally, thanks to yesterday’s drop the commodity slipped under the previously-broken May peak (marked with the blue horizontal dashed line), invalidating the earlier tiny breakout, which is a negative development. Nevertheless, these e
(Click on image to enlarge)
vents will turn into bearish if we see a weekly closure below them later in the day.
From today’s point of view, we see that the commodity closed the previous week under the long-term green resistance line, invalidating earlier breakouts and giving oil bears an important reason to act in the coming week.
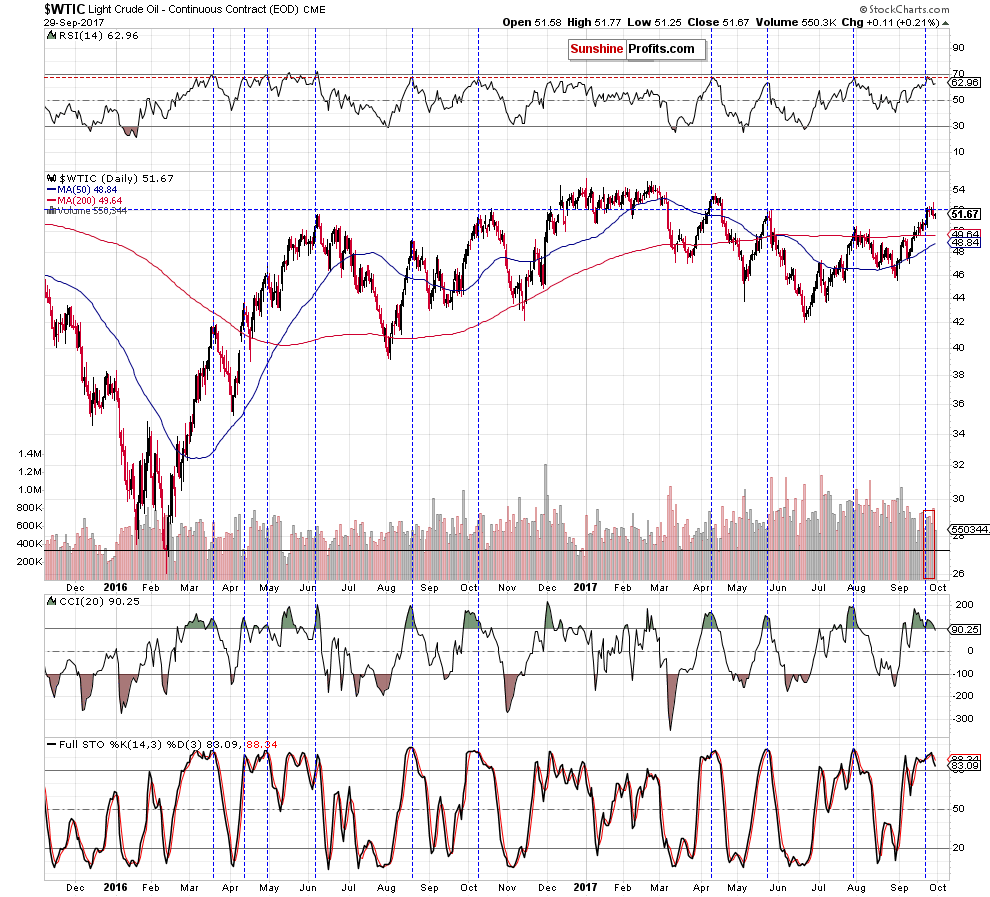
How did this drop affect the very short-term chart? Let’s check.
(Click on image to enlarge)
(Click on image to enlarge)
On the daily chart, we see that although crude oil moved a bit higher on Friday, the size of rebound was small compared to Thursday pullback. Additionally it materialized on visibly lower volume than earlier decline, which increases doubts about oil bulls’ strength and further rally.
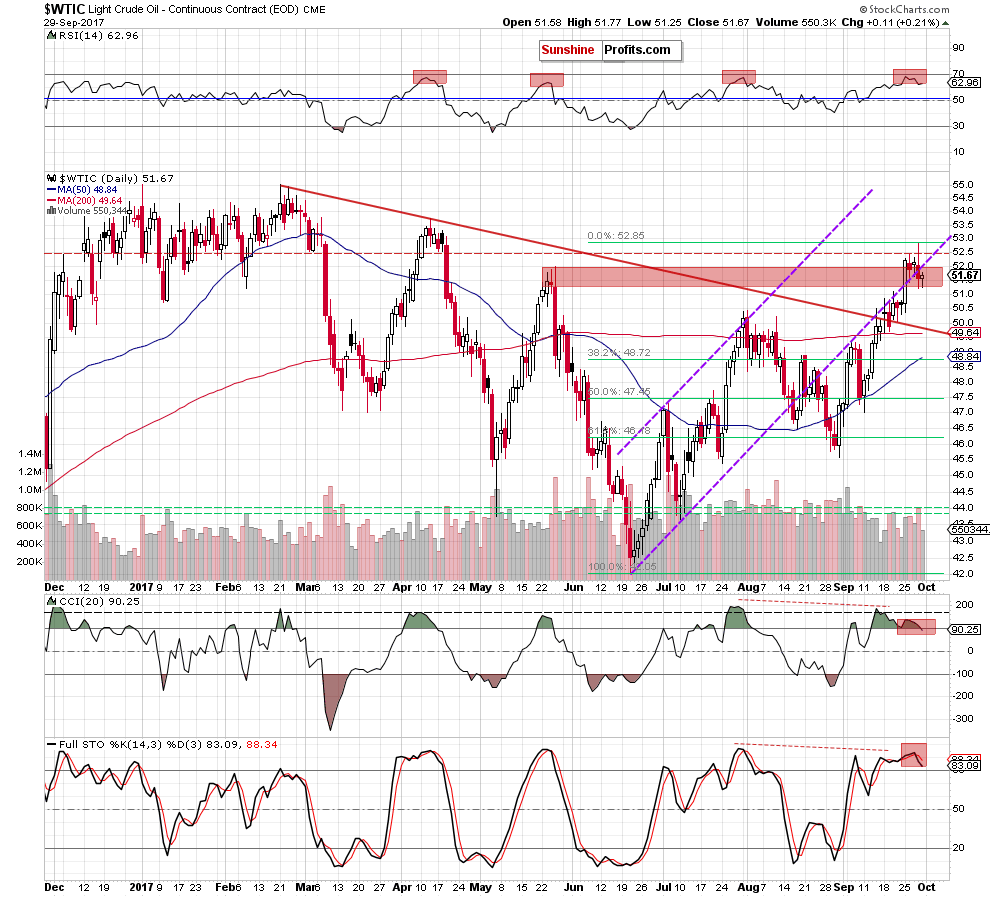
On top of that, crude oil closed another session and the whole week below the recent highs and the previously-broken lower border of the purple rising trend channel, which together with the sell signals generated by the CCI and the Stochastic Oscillator suggests further deterioration in the coming week.
How low could crude oil go?
If this is the case and crude oil declines from current levels, the initial downside target for oil bears will be around $49.85, where the previously-broken red declining line (which serves as the nearest support) is. If it’s broken, we’ll likely see a drop to the 38.2% Fibonacci retracement based on the June-September upward move (around $48.72) in the following days.
Finishing today’s alert please note that Friday Baker Hughes report showed that the number of oil rig rose by 6 to 750 after declining for four of the previous five weeks. In our opinion, this is a negative signal, which will likely increase concerns that U.S. oil output could rebound and push the price of light crude lower in the coming days. This pro bearish scenario is also reinforced by news that OPEC crude oil output increased in the previous month because of higher supplies from Iraq and Libya. Therefore, we believe that short positions continue to be justified from the risk/reward perspective.
Comments
Log in or sign up to join the conversation.