


Reader Steven Kopits writes:
I think 2011 has a decent call on being a recession. It’s the only time in US history when oil consumption fell — and fell substantially — without a called recession, and the next three years were not very good, hence, Summers Nov. 2013 secular stagnation speech. And of course Europe went down like a ton of bricks. They will this time, too.
Here’s US petroleum use (US production plus imports minus exports):
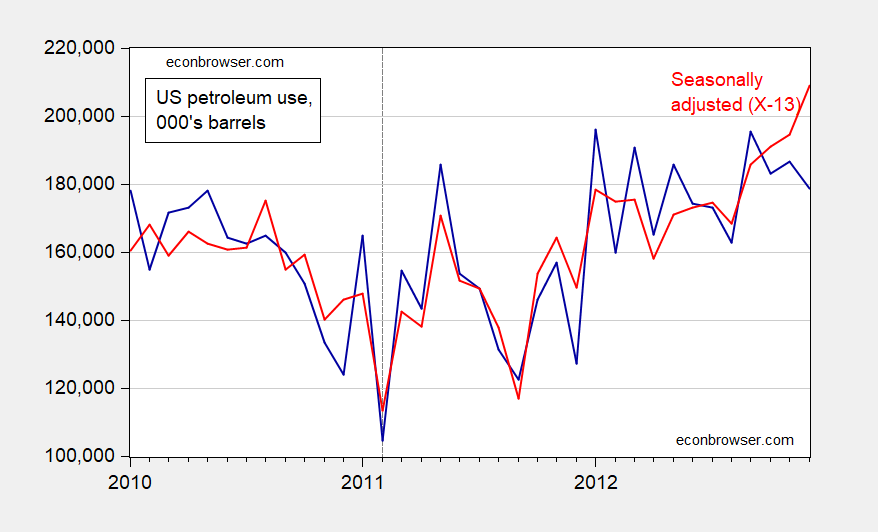
Figure 1: US total petroleum use (blue), and seasonally adjusted (red), in 000’s of barrels. Dashed line at 2011M02. Seasonal adjustment using Census X-13. Source: EIA, and author’s calculations.
What do some of the key indicators follow by the NBER’s Business Cycle Dating Committee follow look like?
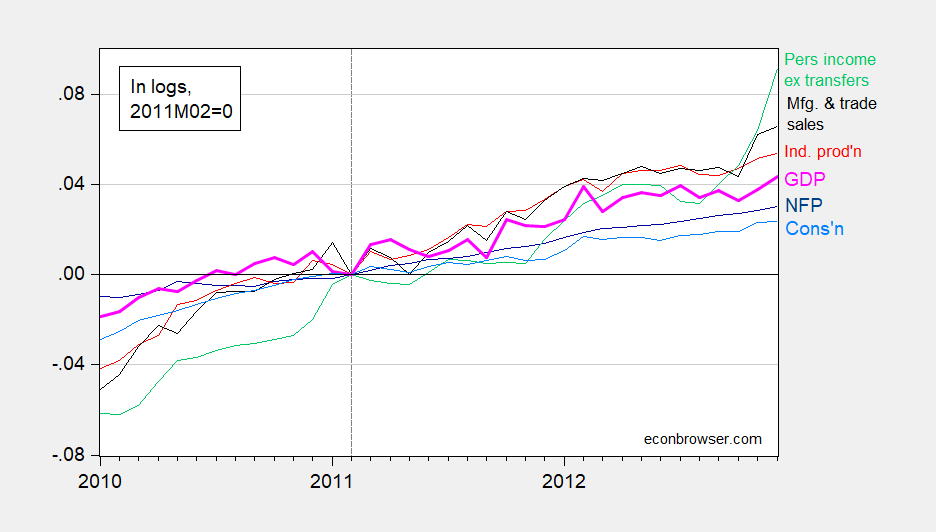
Figure 2: Nonfarm payroll employment (dark blue), industrial production (red), personal income excluding transfers in Ch.2012$ (green), manufacturing and trade sales in Ch.2012$ (black), consumption in Ch.2012$ (light blue), and monthly GDP in Ch.2012$ (pink), all log normalized to 2020M02=0. NBER defined recession dates, peak-to-trough, shaded gray. Source: BLS, Federal Reserve, BEA, via FRED, IHS Markit (nee Macroeconomic Advisers) (6/1/2022 release), NBER, and author’s calculations.
What about GDP and other broad measures at the quarterly frequency? Here’s GDP and Gross Domestic Output (the average of GDP and GDI). The latter is widely viewed as a better measure of output than GDP alone (see discussion by Furman (2016)).
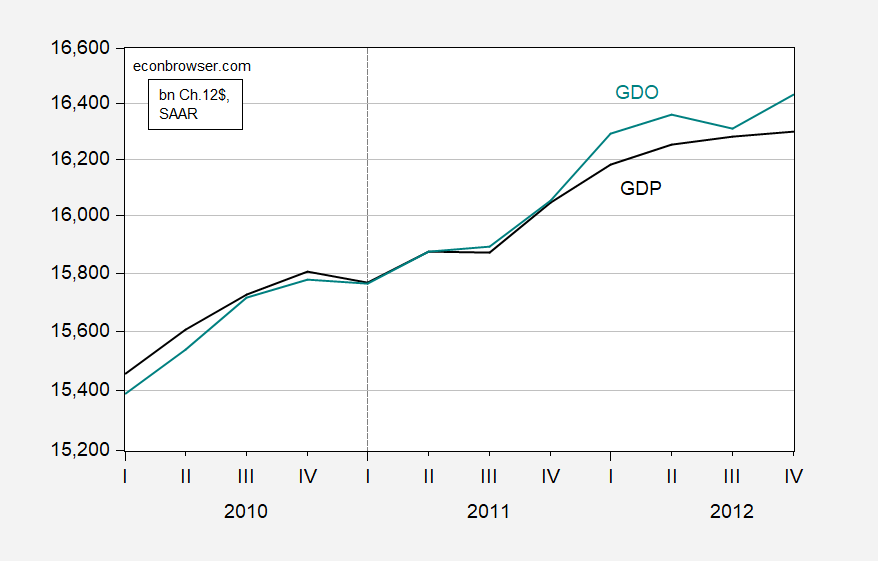
Figure 3: GDP (black), and Gross Domestic Output (teal), both in billions of Ch.2012$, SAAR. Dashed line at 2011Q1. Source: BEA, and author’s calculations.



Comments
Log in or sign up to join the conversation.