
TeleCom Provider West Corp Leads ValuEngine Strong Buys
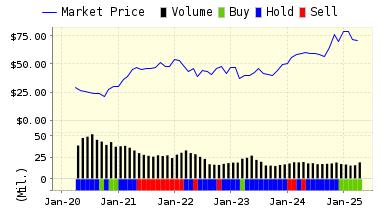
West Corporation (WSTC) offers communication services. The Company provides services which include conferencing and collaboration, unified communications, alerts and notifications, emergency communications, business process outsourcing and telephony/interconnect services. It operates primarily in the United States, Canada, Europe, the Middle East, Asia Pacific, Latin America and South America. West Corporation is headquartered in Omaha, Nebraska.
Our Buy/Sell/Hold recommendations are based upon the 1-year forecast return figure. Using valuation and forecast figures, you can rank and rate our covered stocks against each other, to find out, in an objective and systematic way, the most attractive investment targets based on your own risk/reward parameters. We re-calculate the entire database every trading day, so you are assured that every proprietary valuation and forecast datapoint is as up-to-date as possible.
When we screened for the best 5-Engine STRONG BUY stocks today, the leader was West Corp. These "5-Engine" stocks represent the "best of the best.".
Below is today's more extensive data on WSTC:
RECOMMENDATION: ValuEngine continues its STRONG BUY recommendation on WEST CORP for 2015-07-08. Based on the information we have gathered and our resulting research, we feel that WEST CORP has the probability to OUTPERFORM average market performance for the next year. The company exhibits ATTRACTIVE P/E Ratio and Sharpe Ratio.

|
ValuEngine Forecast |
||
|
Target |
Expected |
|
|---|---|---|
|
1-Month |
30.37 | 1.31% |
|
3-Month |
30.45 | 1.58% |
|
6-Month |
30.99 | 3.38% |
|
1-Year |
34.71 | 15.79% |
|
2-Year |
29.95 | -0.11% |
|
3-Year |
25.94 | -13.46% |
|
Valuation & Rankings |
|||
|
Valuation |
n/a |
Valuation Rank |
|
|
1-M Forecast Return |
1.31% |
1-M Forecast Return Rank |
|
|
12-M Return |
11.87% |
Momentum Rank |
|
|
Sharpe Ratio |
0.95 |
Sharpe Ratio Rank |
|
|
5-Y Avg Annual Return |
20.01% |
5-Y Avg Annual Rtn Rank |
|
|
Volatility |
20.98% |
Volatility Rank |
|
|
Expected EPS Growth |
-11.01% |
EPS Growth Rank |
|
|
Market Cap (billions) |
2.52 |
Size Rank |
|
|
Trailing P/E Ratio |
8.92 |
Trailing P/E Rank |
|
|
Forward P/E Ratio |
10.03 |
Forward P/E Ratio Rank |
|
|
PEG Ratio |
n/a |
PEG Ratio Rank |
|
|
Price/Sales |
1.20 |
Price/Sales Rank |
|
|
Market/Book |
n/a |
Market/Book Rank |
|
|
Beta |
1.23 |
Beta Rank |
|
|
Alpha |
0.05 |
Alpha Rank |
VALUATION WATCH: Overvalued stocks now make up 52.71% of our stocks assigned a valuation and 17.73% of those equities are calculated to be overvalued by 20% or more. Nine sectors are calculated to be overvalued--three by double digits.
Comments
Log in or sign up to join the conversation.