

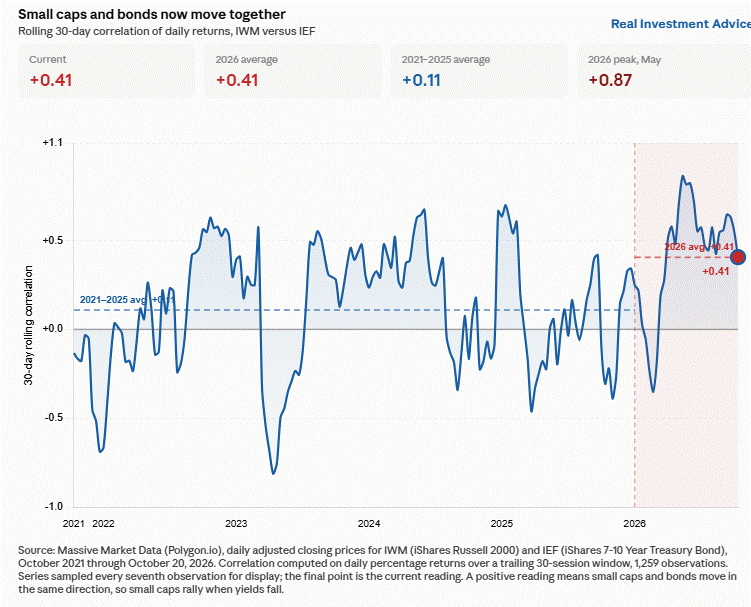
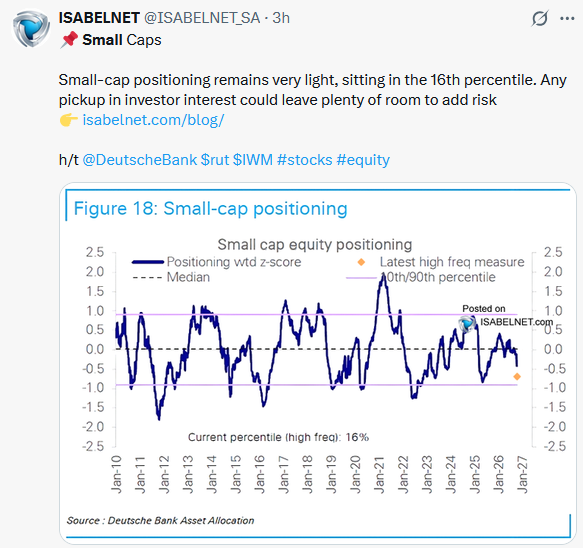
The Russell 2000 Index of small-cap stocks has fallen 8.2% since late June and has not made a new high in four months, a stretch during which the S&P 500 repeatedly set records. However, they have been trading better recently as bond yields have fallen. That correlation is no coincidence, and understanding why small-cap stocks have been linked to bond yields helps explain some important differences between small-cap and large-cap stocks. Small companies face three structural interest-rate sensitivities that most large companies are much less sensitive to.
Floating-rate debt. Roughly 40% of Russell 2000 debt reprices with short-term rates, compared to a far smaller share for the S&P 500. Many large corporations issued debt at very low rates during the pandemic; as a result, they have been reasonably insulated from higher interest rates. Smaller borrowers rely much more heavily on floating-rate bank credit lines and leveraged loans.
Riskier credit demands shorter maturities. Because they tend to be riskier than larger-cap stocks, small caps often borrow for shorter periods to meet bond investor demands. Accordingly, each maturity triggers a repricing event at prevailing rates. As a result, they are more susceptible to changes in rates and credit conditions.
Profitability. Roughly 40% of Russell 2000 constituents lose money. Because the stream of expected earnings is further in the future than for most profitable companies, higher discount rates reduce the present value of distant cash flows more than near ones.
Given the recent spate of high rates, small caps have underperformed the broader market but are more likely to outperform if yields continue to decline. It’s worth noting, however, that if yields fall rapidly due to credit concerns or an economic growth scare, the yield-benefit to small-cap companies might be less meaningful or even detrimental.
As we share below, the rolling 30-day correlation between the Russell 2000 and the 7- to 10-year Treasury has averaged 0.41 in 2026, versus 0.11 over the prior four years. It peaked at 0.87 in May. Before this year, the relationship oscillated around zero and spent long stretches negative, reaching -0.83 during the March 2023 banking stress.
What To Watch Today
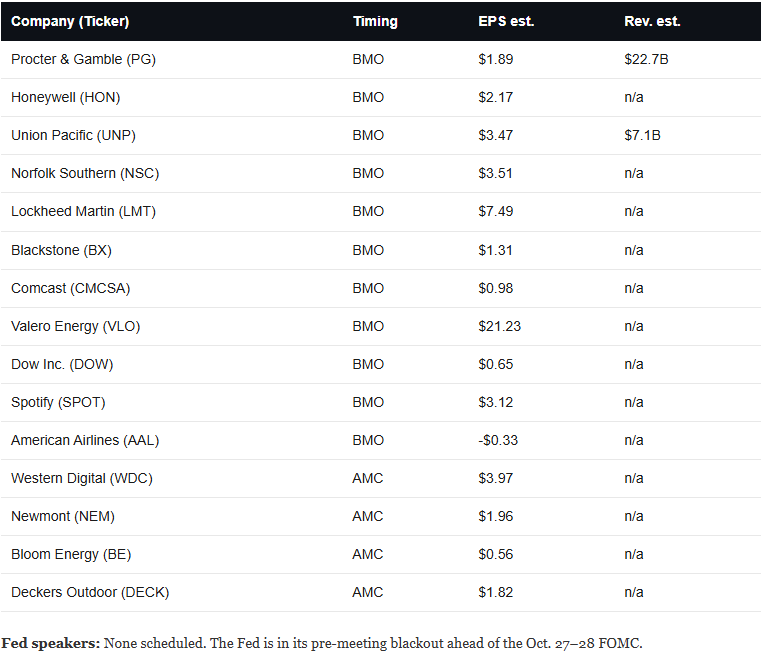
Earnings
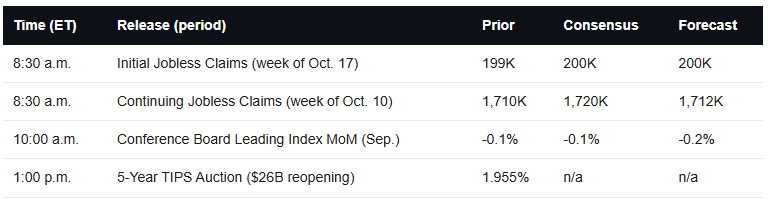
Economy
Market Trading Update
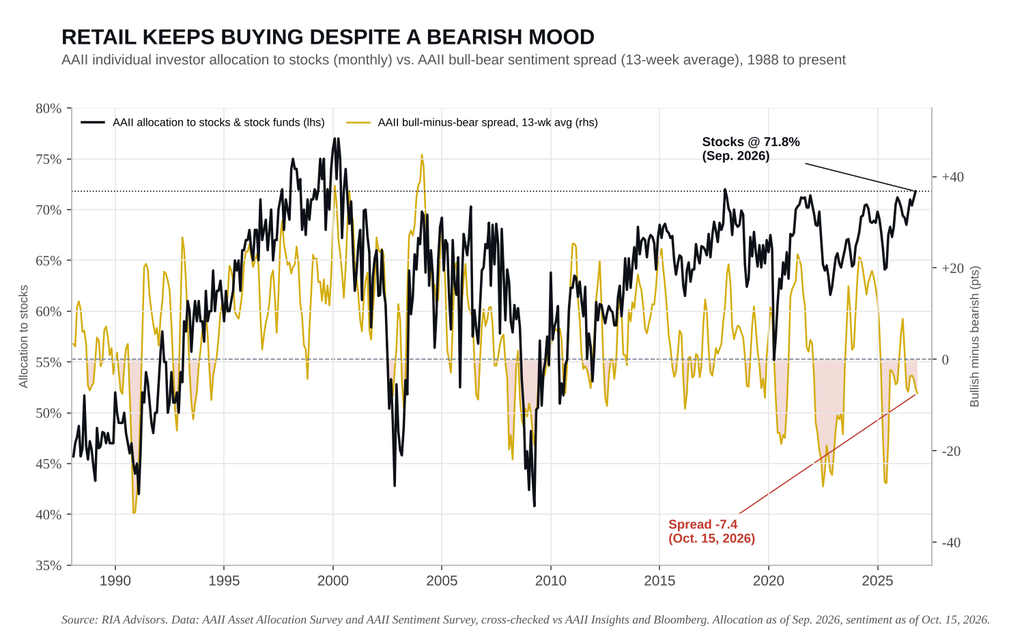
Yesterday, we discussed Michael Wilson’s argument that this correction won’t end until the megacap leaders take their turn lower. Today, I want to look at who is holding the stocks if that happens. The latest retail stock allocation data gives a clear answer. It’s “Main Street,” and Main Street owns more equity than at almost any point in the last 25 years.
As Bloomberg’s Simon White noted this week, the AAII asset allocation survey shows individual investors holding 71.8% of their portfolios in stocks. Outside a brief 72% print at the end of 2017, just before “Volmageddon,” you have to go back to the 2000 tech bubble to find a higher reading. Notice the divergence in the chart below that matters. The black line, allocation, keeps climbing while the blue line, the bull-minus-bear spread, has rolled over into negative territory.
That mood is real. In last week’s AAII survey, bears rose to 41.6%, up from 38.7% bulls. Bearish sentiment has now run above its 31.5% long-term average for 36 straight weeks.
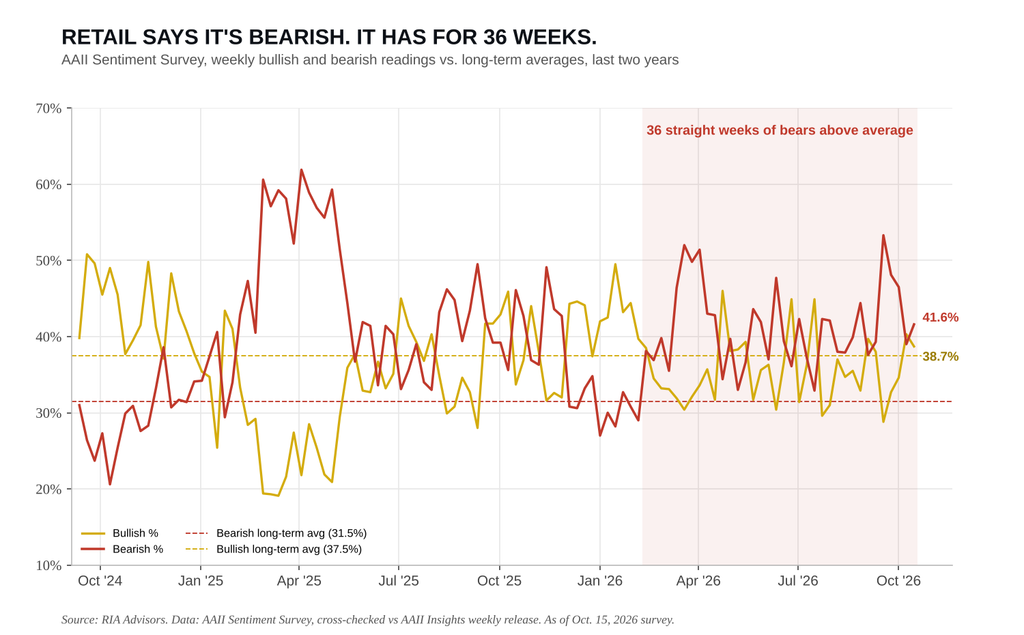
The contrarian in the back of the room will say heavy bearishness is a buy signal. Usually, it is. BUT sentiment only matters when it changes behavior, and so far it hasn’t. Investors tell surveyors they’re worried, while their brokerage accounts say otherwise. When investors say they’re afraid but stay fully invested, the fear isn’t a cushion. It’s a trigger waiting for a reason.
The Conference Board data shows the same split. More than half of respondents expect stocks to be higher in 12 months, a near 35-year high for that series. Meanwhile, the share expecting lower rates and lower inflation has dropped sharply in recent months.
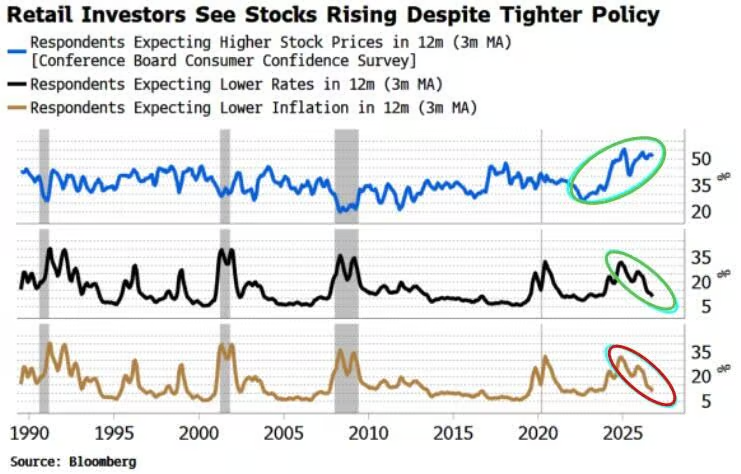
Retail expects stocks to rise even as the policy backdrop gets less friendly. There are certainly some concerns rising over the market as Burry, Grantham, Klarman, Dalio, and now Ken Griffin are calling it an AI “bubble.” The agreement isn’t in the forecasts this time. It’s in the positioning. When nearly everyone is already long, the pool of marginal buyers is shallow the moment a shock arrives.
This isn’t a call to sell everything. It’s a call to own less of what everyone else owns. We’re holding technology at target weight across our equity models, not adding, and continuing to rebalance from megacap strength toward sectors that have already corrected. A close below 7,567 on the S&P 500 remains our line to raise cash and add hedges. If your equity exposure crept past 70% because the last three years made it feel normal, trim back to target now, while the bid is still there.
Such is the nature of a crowded room. The exits never get wider when everyone needs them at once.
SpaceX Launches On Strong Earnings
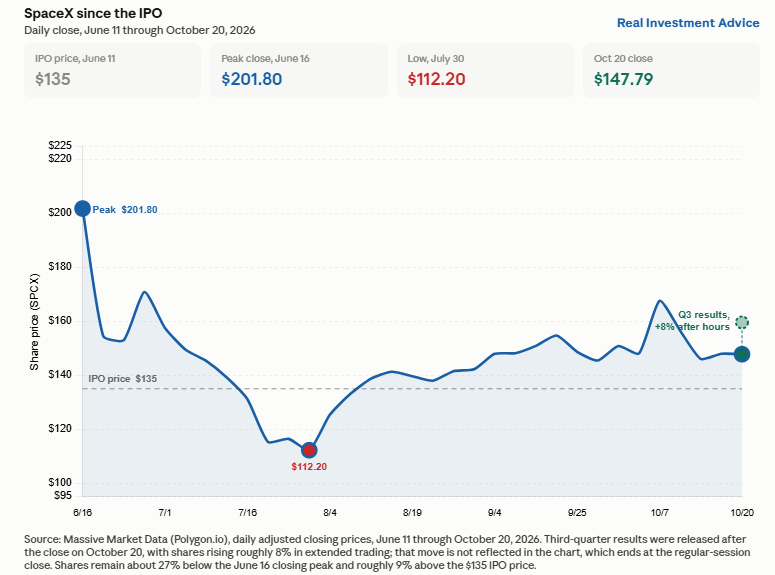
SpaceX shares rose about 8% Tuesday night after reporting its first quarterly earnings as a public stock. Its revenue reached $14.58 billion, up 161% from $5.6 billion a year ago and well above the $12.87 billion consensus. Net income came in at $4.4 billion against a $1.1 billion loss in the prior-year quarter..
Revenues are broken down by segment as follows.
The Super Intelligence segment, previously reported as AI, generated $7.56 billion, up 830% year over year and 195% from the second quarter. It is now larger than Starlink.
Connectivity (Starlink) rose 69% to $5.25 billion, with subscribers reaching 13.6 million and average revenue per user up slightly to $69 from $66.
Space contributed $1.77 billion, including the first revenue-generating Starship mission.
While revenue was better than expected, spending also exceeded estimates. Capital expenditures hit $19.6 billion in the quarter, exceeding revenue by roughly $5 billion. The large majority, $16.4 billion, went to the Super Intelligence business. Its 9-month capex total stands at $48.1 billion.
A company spending 134% of revenue on capex while posting record profit is an unusual combination. This is because accounting treats capex as converting cash into property and equipment, not as an expense. The cost reaches the income statement gradually, as depreciation, over the asset’s useful life. For instance, a data center depreciated over six years contributes roughly one-sixth of its cost to expenses each year rather than all of it at purchase.
SpaceX free cash flow fell by roughly $10 billion. Fortunately, the company started the quarter with $100 billion (IPO proceeds) in cash and marketable securities, so it will not need to borrow in the capital markets for the foreseeable future.
Musk also said Tesla and SpaceX have formed special committees to discuss a merger.
Are Bonds Pricing In A Fed Policy Mistake?
Imagine someone looking into their crystal ball and telling you at the beginning of October that the coming September CPI data would be higher than expected, and producer prices (PPI) would rise 1.3% for the month, well above the 0.5% forecast. On top of the bad inflation news, they also said more inflation pressure was brewing, with crude oil prices rising $10 through the first two weeks of the month. Based on that foresight, where would you guess the 10-year Treasury yield would be? To help you answer, the ten-year US Treasury yield was flirting with 5.25% on October 1. We bet most professional bond traders would have bet on 5.50% or even higher.
On October 14th, the 10-year Treasury yield surged after the CPI report, hitting 5.33% minutes after the release. A few days later, it was markedly lower at 5.03%. The 30-year yield fell by a similar amount. Bonds rallied into the teeth of the bad inflation data.
Mohamed El-Erian, ex CEO of PIMCO and renowned bond expert, asked the obvious question on X:
Why are US government bond yields falling despite hotter-than-expected CPI and PPI inflation prints?
He offered two valid rationalizations. In this article, we walk through his two AI-related explanations and add two of our own. Importantly, we emphasize one we think matters most: the bond market may be starting to price in the risk that the Fed is being pushed into a policy mistake.
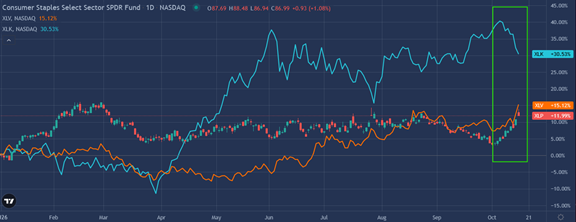
Tweet of the Day


Comments
Log in or sign up to join the conversation.