

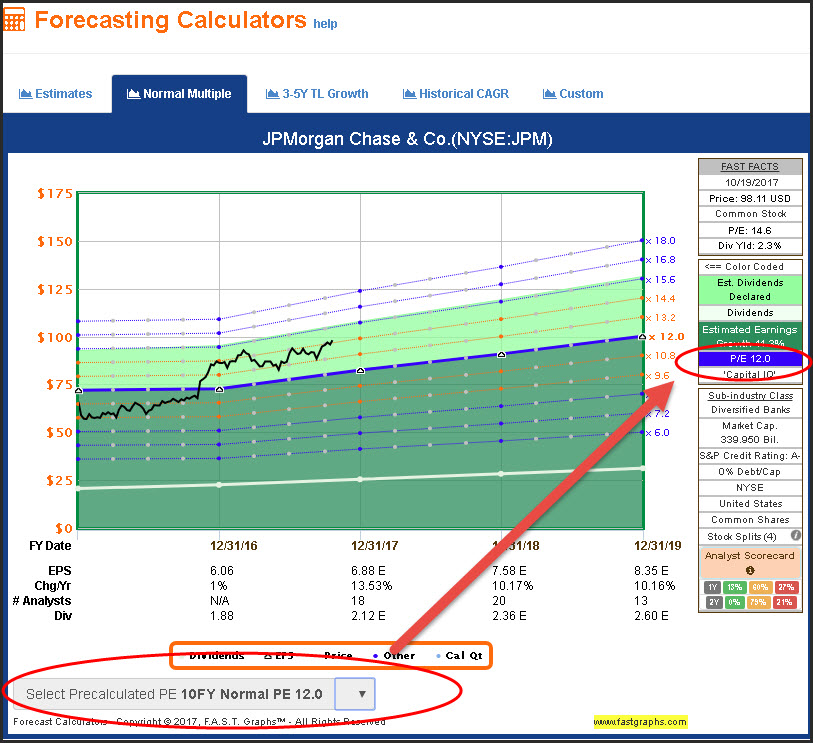
The earnings and price correlated historical graph (the main graph) includes forecasting data when you are running timeframes. In contrast, the “Historical” normal P/E ratio forecasting calculator is utilizing only completed historical data.
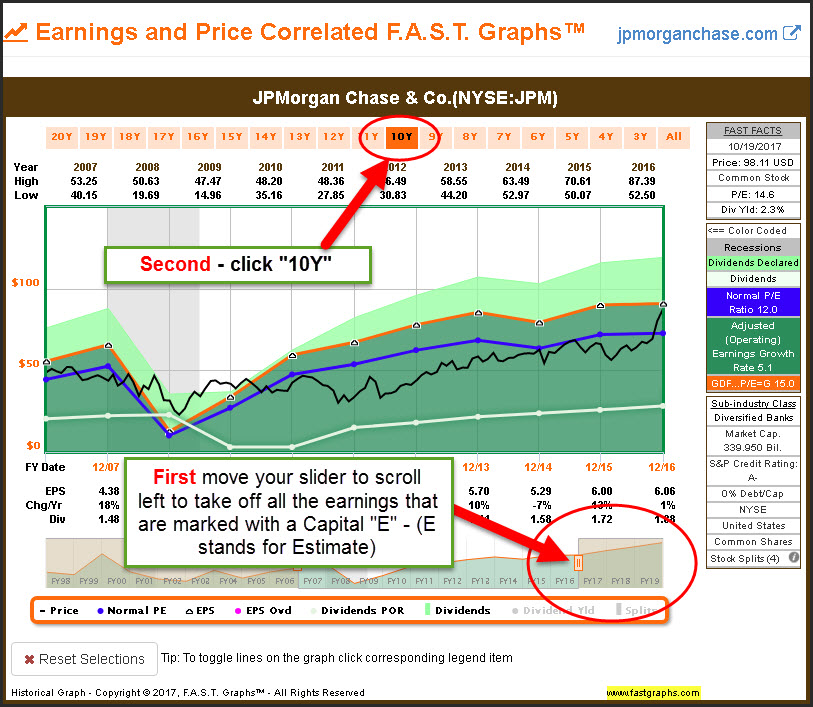
Therefore, in order to get the same normal P/E ratio on both the main graph and the forecasting graph, you have to scroll all of the earnings that are marked with a capital “E” off of the main graph, and then click the number of years you are looking for. By doing this, you will get the pure historical normal P/E ratio with no forecasting data included.
Here is an example below – using the 10-year timeframe:



Comments
Log in or sign up to join the conversation.