

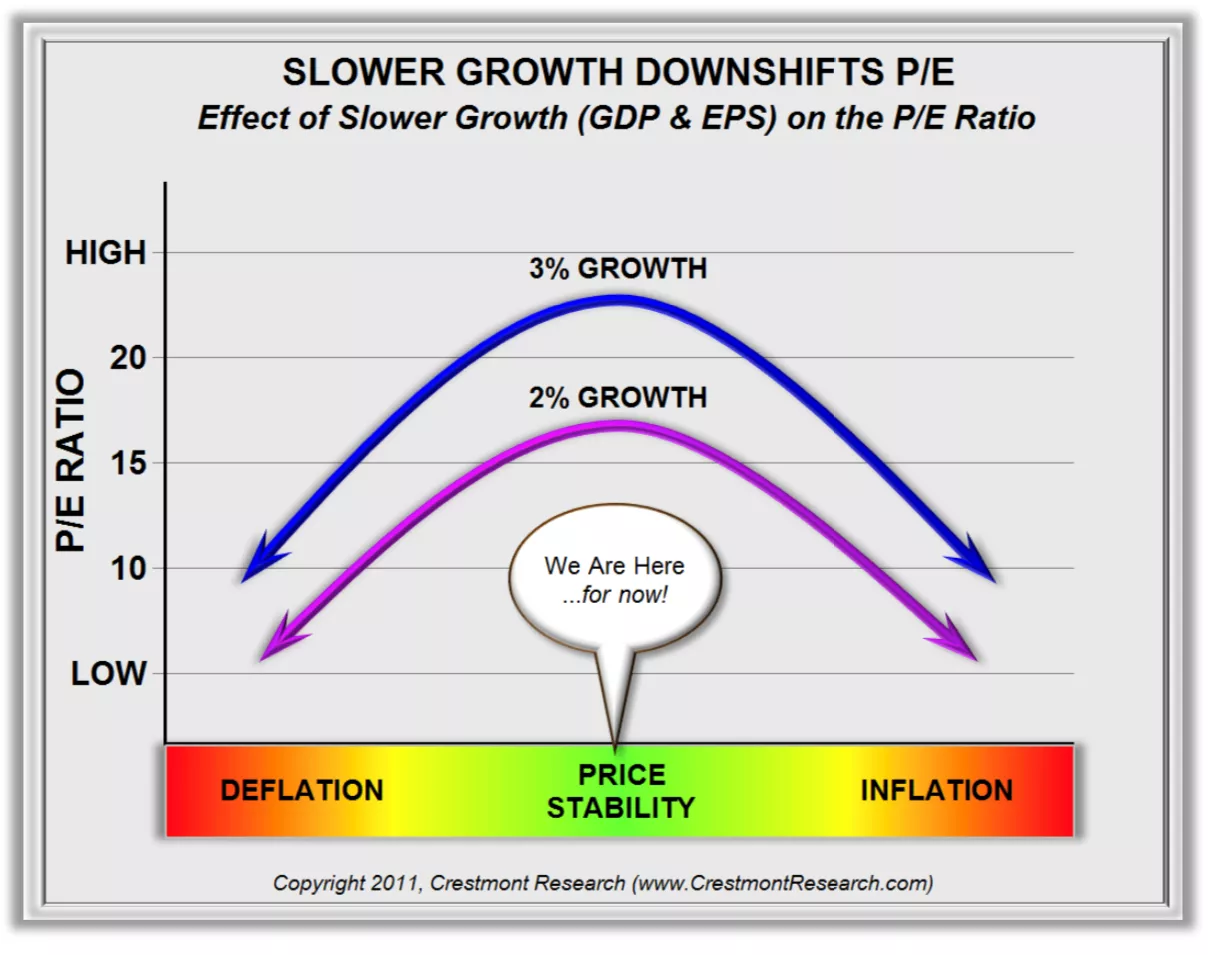
The historical average for P/E has been between 15 and 16, but if over the previous century real economic growth had averaged 2% rather than 3.3%, it would have been closer to 11.
Under circumstances of moderate and stable inflation rates, the maximum P/E range has been 20 to 25. Under circumstances of material deflation or high inflation, the low range for P/E has historically been 5 to 10.
Lower P/E ranges are a result of slower growth and higher inflation, which will have an impact on future determinations of reasonable value.


Comments
Log in or sign up to join the conversation.