

Summary
- Today is too early to get back in.
- Monitor the various daily moving averages.
- Wait until you are comfortable with the reliability of the data to get back in.
The whole economy has lots and lots of moving parts --- too many parts for anyone, even the professionals to predict what will happen.
The main moving parts, not only for the economy but also for each of the individual companies are:
- The Corona Virus
- The effect of the Stimulus Package
- How will stockholders view the company ?
- How cooperative will creditors and landlords be ?
- Have their suppliers survived ?
- Will their employees, especially their best ones come back to work or have they moved on ?
- Will their customers return ?
- Do their customers have the money to return ?
- Were they capitalized well enough to weather the storm ?
- How long will it take them to return to a positive cash flow ?
- How long will it take to make up all their previous losses after they reach a break-even point ?
- Can they become profitable again or will they eventually have to throw in the towel and close the doors for good ?
This is not an exhaustive list of all the factors but this list will definitely make or break individual companies.
Because of all these variables when I return to the market I will not be buying individual stocks for the first 6 months. I will buy broad Index ETFs and let the free market decide which companies will survive, which will have to close the doors and which will prosper.That will take some time.
Each day Barchart publishes on the Stock Market Momentum & Daily Stock Activty page the following table:
MARKET AVERAGE
The percentage of stocks in BCMM above their individual Moving Average per period.
| 5-Day MA | 20-Day MA | 50-Day MA | 100-Day MA | 150-Day MA | 200-Day MA | |
|---|---|---|---|---|---|---|
| Today | 87.30% | 15.18% | 4.43% | 5.64% | 7.59% | 8.52% |
| Yesterday | 79.55% | 9.38% | 3.55% | 4.97% | 6.33% | 7.43% |
| Last Week | 15.21% | 3.15% | 2.59% | 3.45% | 4.73% | 5.18% |
| Last Month | 6.84% | 12.99% | 22.03% | 33.29% | 38.24% | 40.86% |
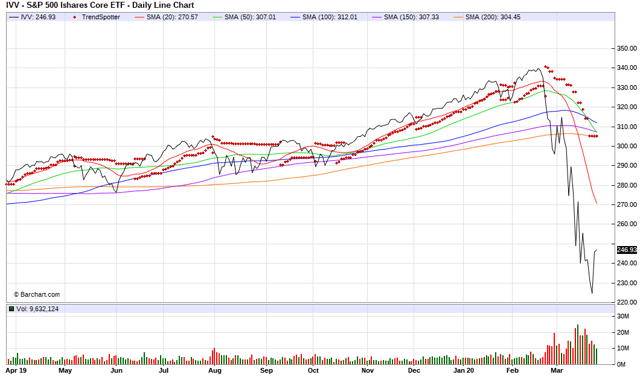
I will buy back into the the market when this page shows that 50% of the stocks are trading above their 20 day moving average in a 25% increment. I will buy another 25% increment when 50% of the stocks are selling above their 50 day moving average and then again when the same is true for 50% of the stocks trading above their 100 and 150 day moving averages. I will be setting my stop losses at the 200 day moving average and wait for the time that I can begin again to believe that the data has some reliable predictability for individual stocks
Here is a chart of the S&P 500 Large Cap ETF (IVV) and I will use it and the table above to be my rational guide to getting back in:
(Click on image to enlarge)
This may not work for all of you, but I thought I would share the method that I'm comfortable with.
Be careful. Be rational.



Comments
Log in or sign up to join the conversation.