


In this technical blog, we’ll take a closer look at our Elliott Wave charts for Wheat Futures. We identified incomplete bearish sequences within the cycle from the 796' peak, signaling further downside ahead. In the following analysis, we’ll examine the Elliott Wave structure and see how the market followed our projected path lower.
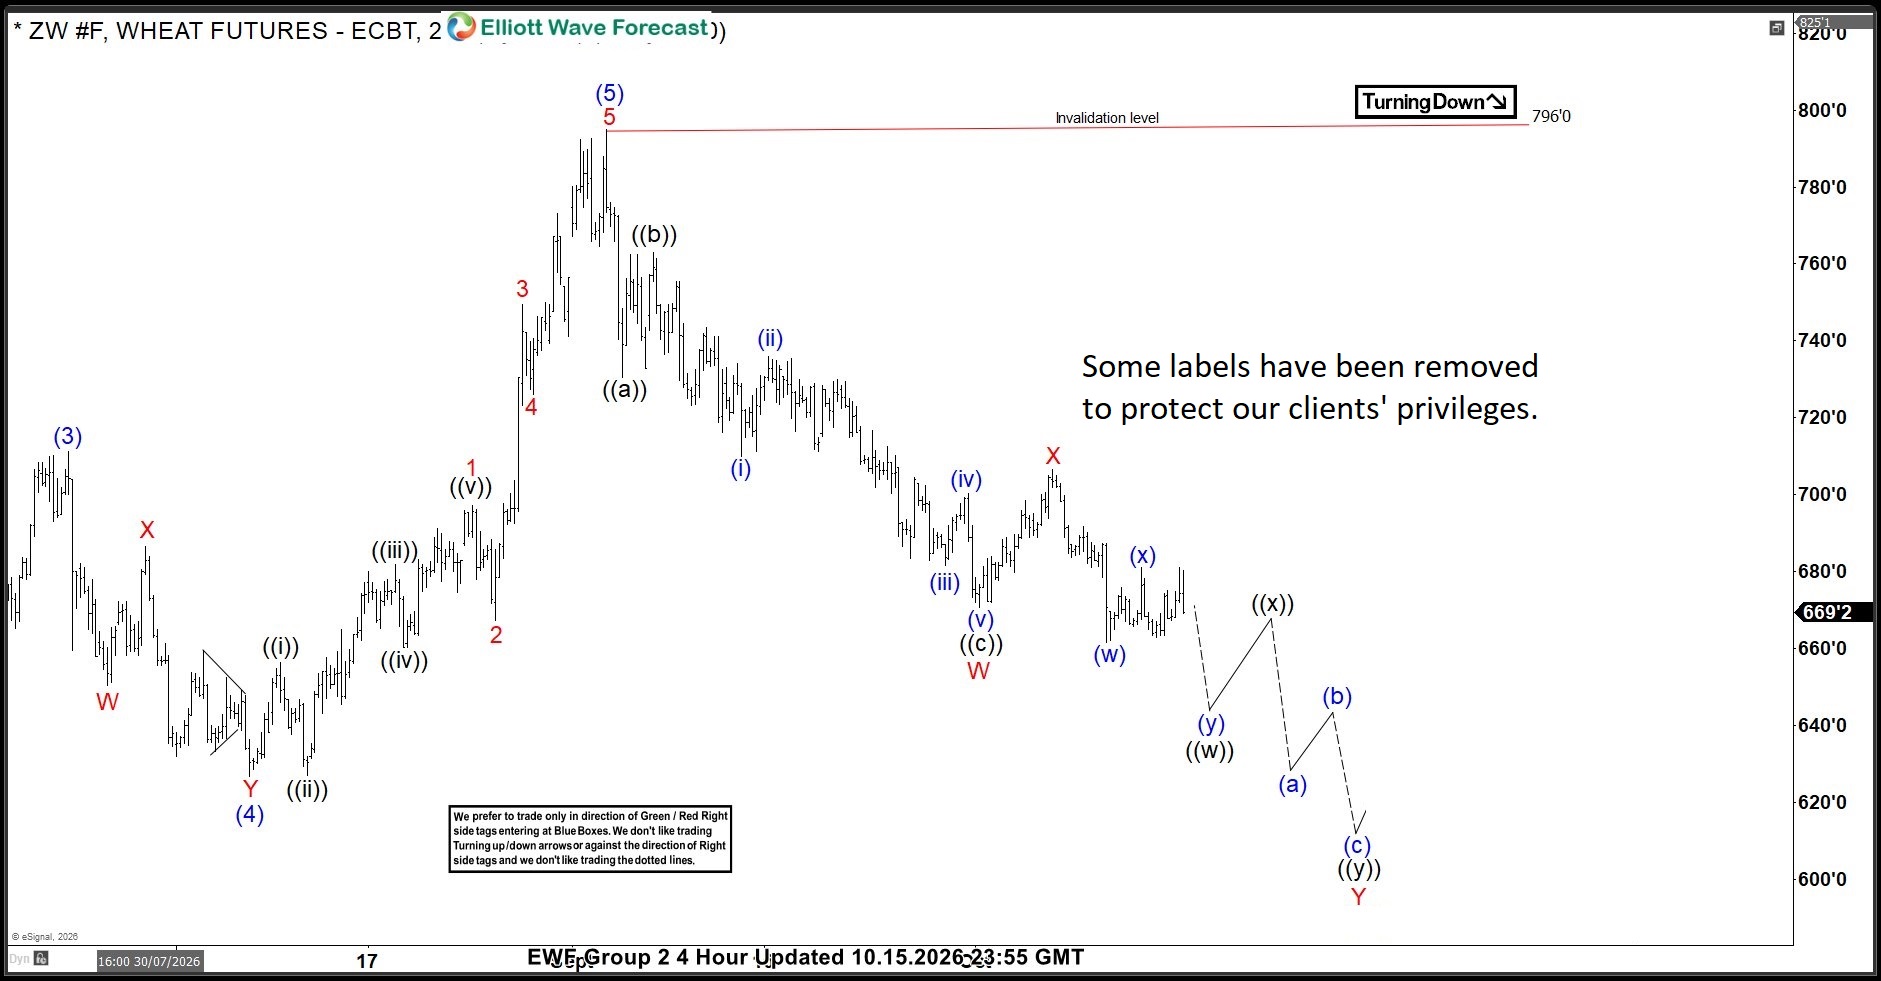
ZW_F Elliott Wave 4-Hour Chart 10.15.2026
Wheat Futures (ZW_F) developed bearish sequences within the cycle from the September 2 peak at 796'. Our analysis indicated that the cycle remained incomplete, with price trading within the red Y leg of a potential Double Three pattern. As long as price remained below the red X high at 706', we expected the commodity to continue moving lower, with a downside target around 584'2.As our members know, we determine the completion target of a Double Three pattern by measuring the Equal Legs zone of wave W in relation to wave Y, using the Fibonacci extension tool.
At that stage, we did not favor buying Wheat Futures. Instead, we maintained a bearish outlook and favored the short side, anticipating further downside toward our projected target zone.
It is important to understand that we do not rely on Elliott Wave analysis in isolation. We combine it with cycle analysis and market correlations, examining multiple time frames to develop a clearer picture of market behavior.
This combined approach allowed us to anticipate the bearish continuation and identify the downside target zone in advance.
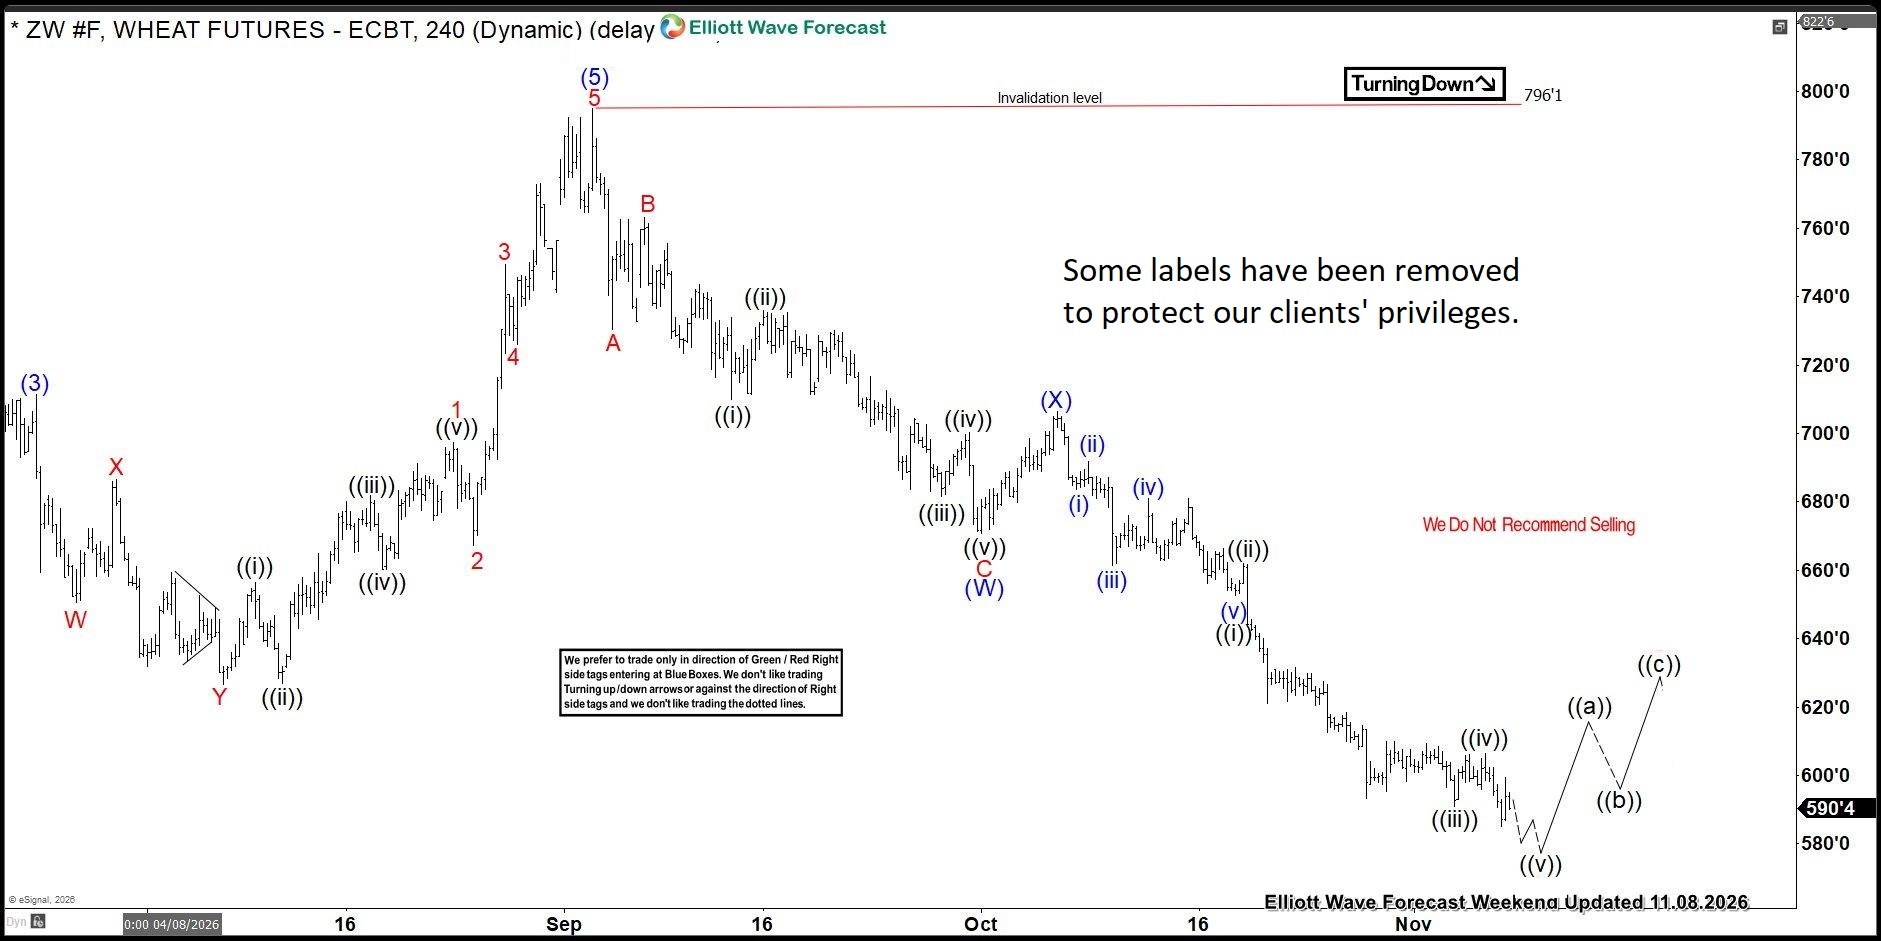
ZW_F Elliott Wave 4-Hour Chart 11.08.2026
Once again, incomplete bearish sequences accurately anticipated the market's path. Wheat Futures declined as expected and are now reaching our previously identified target area around 584'2, where the cycle from the major 796'1 peak could be approaching completion.



Comments
Log in or sign up to join the conversation.