

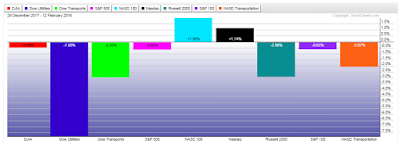
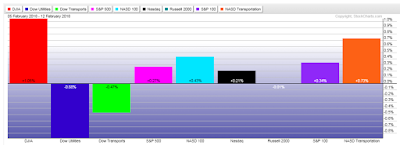
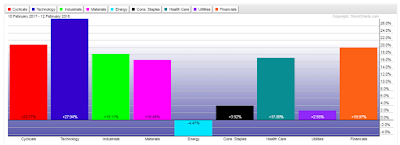
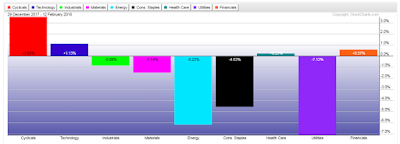
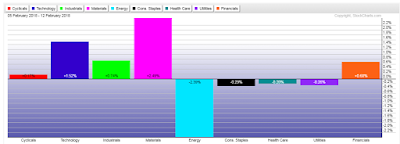
Depicted on the following graphs are percentages gained/lost in Major Indices and Major Sectors over a longer term (1 year), a medium term (year-to-date), and a short term (the past week).
They are presented, simply, to illustrate where they are relative to those three timeframes.
My only comments are as follows:
- Major Indices: Utilities, Small Caps and Transports continue to underperform, and I'd monitor Small Caps, in particular, as I outlined in yesterday's article, for further signs of weakness and an indicator of further equity risk-off activity
- Major Sectors: Energy, Consumer Staples, Health Care and Utilities continue to underperform, but I'd keep an eye on Financials for any evidence of further weakening, as I recently described here
Finally, the "volatility gauges" mentioned in this post may also offer clues on equity direction, as well as index/sector and risk on/off preference in the weeks ahead. I referred to Technology in that article, and it's, especially, worth monitoring, inasmuch as a marked weakening of that sector could have quite a negative impact on equities, as a whole.
(Click on image to enlarge)

(Click on image to enlarge)
(Click on image to enlarge)
(Click on image to enlarge)
(Click on image to enlarge)
(Click on image to enlarge)



Comments
Log in or sign up to join the conversation.