


I saw some interesting numbers being thrown around last week that have me a bit concerned for your wealth and your income. So, you know, I had to address it right here.
We know that the first week of November was the worst week the market has seen since April 2025. Earnings season was in full swing, and we had the midterm elections. A lot of information was hitting the market, so a reaction was expected.
Here’s the scary part.
Apparently, that same week retail investors also pulled $3.4 billion out of individual stocks. That was slightly offset by $1.4 billion that flowed into equity ETFs, but it still resulted in a net negative $2.1 billion for retail investors (people like you and me). This was the fourth straight week of net selling.
Institutional investors, however, put $4 billion into ETFs and $2.1 billion into individual stocks. It seems like they are taking a page out of Warren Buffett’s playbook.
In his 1986 letter to Berkshire Hathaway (BRK-A) shareholders, the Oracle of Omaha explained that you can’t predict when markets will swing between fear and greed. But when one sentiment takes over the market, you should do the opposite.
Be fearful when others are greedy and greedy when others are fearful.
It sounds obvious, right? That’s how you’re going to buy low and sell high. You want to lock in bargains when others are panic selling and then methodically take your gains while everyone else is pumping up the bubble.
Define A Bargain
I hope those retail investors that were caught up in selling were taking gains off the table, or swapping lower dividend yields for Treasuries. Anything that makes sense, other than just turning their backs on a good deal.
If you’re reading Dividend Digest, you’re probably a long-term investor. Dividends are usually paid out quarterly, occasionally monthly. Either way, you need to hold those positions long enough to get the juice out of the lemon. If you are a long-term investor, now is the worst time to abandon your positions. (Locking in gains is another story; right now, I’m focusing on buying the dips).
That’s all easy to say, but how do you find a bargain?
Here’s where we should take a step back and look toward Buffett’s teacher and the father of value investing—Benjamin Graham. He started looking for bargains on Wall Street since 1914.
His general rule was not to pay more than 15 times average earnings over the past three years. And don’t pay more than about 1.5 times book value. Multiply those two measures together, and the result shouldn’t be more than 22.5. These numbers are straight out of the fourth edition of his book The Intelligent Investor, the final one that Graham was alive to edit himself. To put them in perspective, the trailing P/E of the S&P 500 at the time (1973) was around 18.
The two numbers Graham used are fairly easy to find and use. The first number is a modified price-to-earnings ratio. I’ll show you how to calculate this in a moment, but if you want a simplified metric, most stock quote summaries report the most recent value as P/E or PE Ratio. The second number is price-to-book, usually shown as P/B. Book value is the net value or assets minus liabilities as recorded on a company’s balance sheet.
From Theory to Practice
If you want to accurately follow Graham’s advice, you’ll modify the standard P/E formula to divide by the average earnings for the last three years. These are easy to find in the full-year earnings; just look for the GAAP earnings per share. Your AI tool of choice should also be able to pull these numbers quickly for you, but always check its source.
Trying to explain math with words gets confusing, so let’s look at some real examples.
Let’s use Target Corp. (TGT). My Essential Income readers grabbed shares last March at a great entry price of $106.09. We’re up 50.4%, not even counting our dividend payments. Shares are no longer a bargain, and the question is how “overpriced” they are.
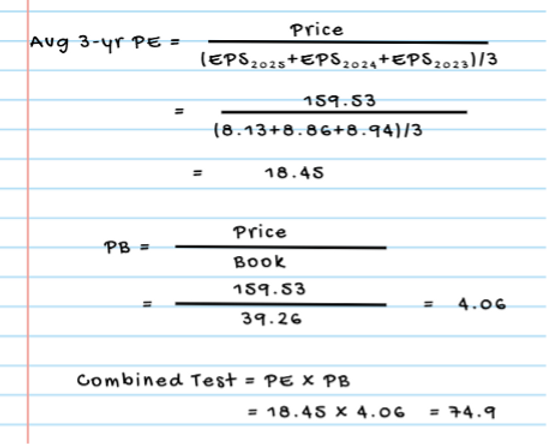
The three-year average P/E doesn’t look half bad at 18.45. It’s above Graham’s target but still below the S&P 500’s current trailing average of around 24. The price-to-book and combined test are much higher than Graham would have wanted. This confirms my thoughts that we should continue to hold while keeping an eye out for our exit point.
How about BCE Inc. (BCE)?
This Canadian telecom giant cut its dividend back in May 2025. A few months later, it announced a three-year plan for sustainable growth. We’re seeing evidence that the plan is working, but are shares at a good price to buy?
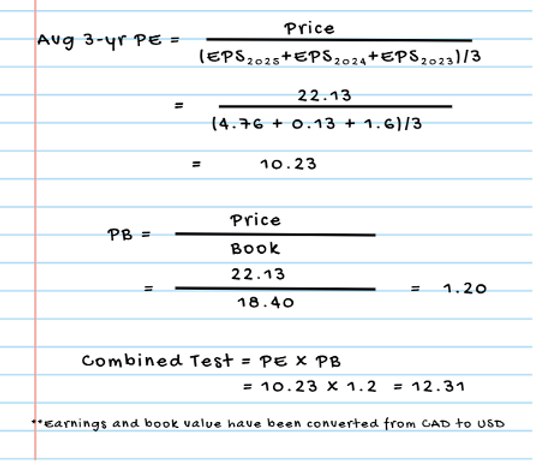
By Graham’s measures, BCE looks like a good bargain right now. I’ll take the confirmation to hold TGT and keep adding to my BCE position.
Please note, I wouldn’t use these numbers as your only valuation gauge to judge whether you should buy a stock. These metrics are useful to confirm or challenge your intuition. They are firm numbers instead of the subjective impressions you get from reading press releases and analyst commentary.
This line of thinking can also be useful when you’re looking for new opportunities. Many stock screeners let you filter by valuation metrics. Personally, I usually use 0 to 17 for my P/E range and 0 to 2 for my P/B. This is slightly above Graham’s thresholds but has served me well over the years.
This is a great tool to have in your toolbox as markets stay choppy. Keep looking for bargains and maximizing your dividend yield.



Comments
Log in or sign up to join the conversation.