

Summary
- We expect yields to be generally on the rise for another week or so -- equities should rise alongside. We have reset our long equity scalpers in RTY and ES.
- The liquidity models overrode the EWP technical wave action analysis -- looking for fundamental equity support from rising Treasury Cash Balance, Bank Reserves, and SOMA Transactions near-term.
- The short-tern outlook of rising yields get support from rising bond term premia and breakevens but the onset of seasonal liquidity which lasts till late March is just days away.
- If Debt Issuance (Total Debt) falls, Treasury Cash Balance also falls in nominal amounts. It does not mean that Bank Reserves will rise in terms of nominal amount -- it will only rise percentage-wise or ratio-wise to TCB. Bank Reserves and TCB have Yin-Yang relationship, but they are not directly inverse. Bank Reserves will fall too in nominal amounts. BR is not created ab nihilo -- it comes as a consequence of debt issuance and Fed monetizing that debt. If you lessen issuance, then nominally Bank Reserves will fall too. Its only the RATIO or PERCENTAGE of BR over TCB which will rise.
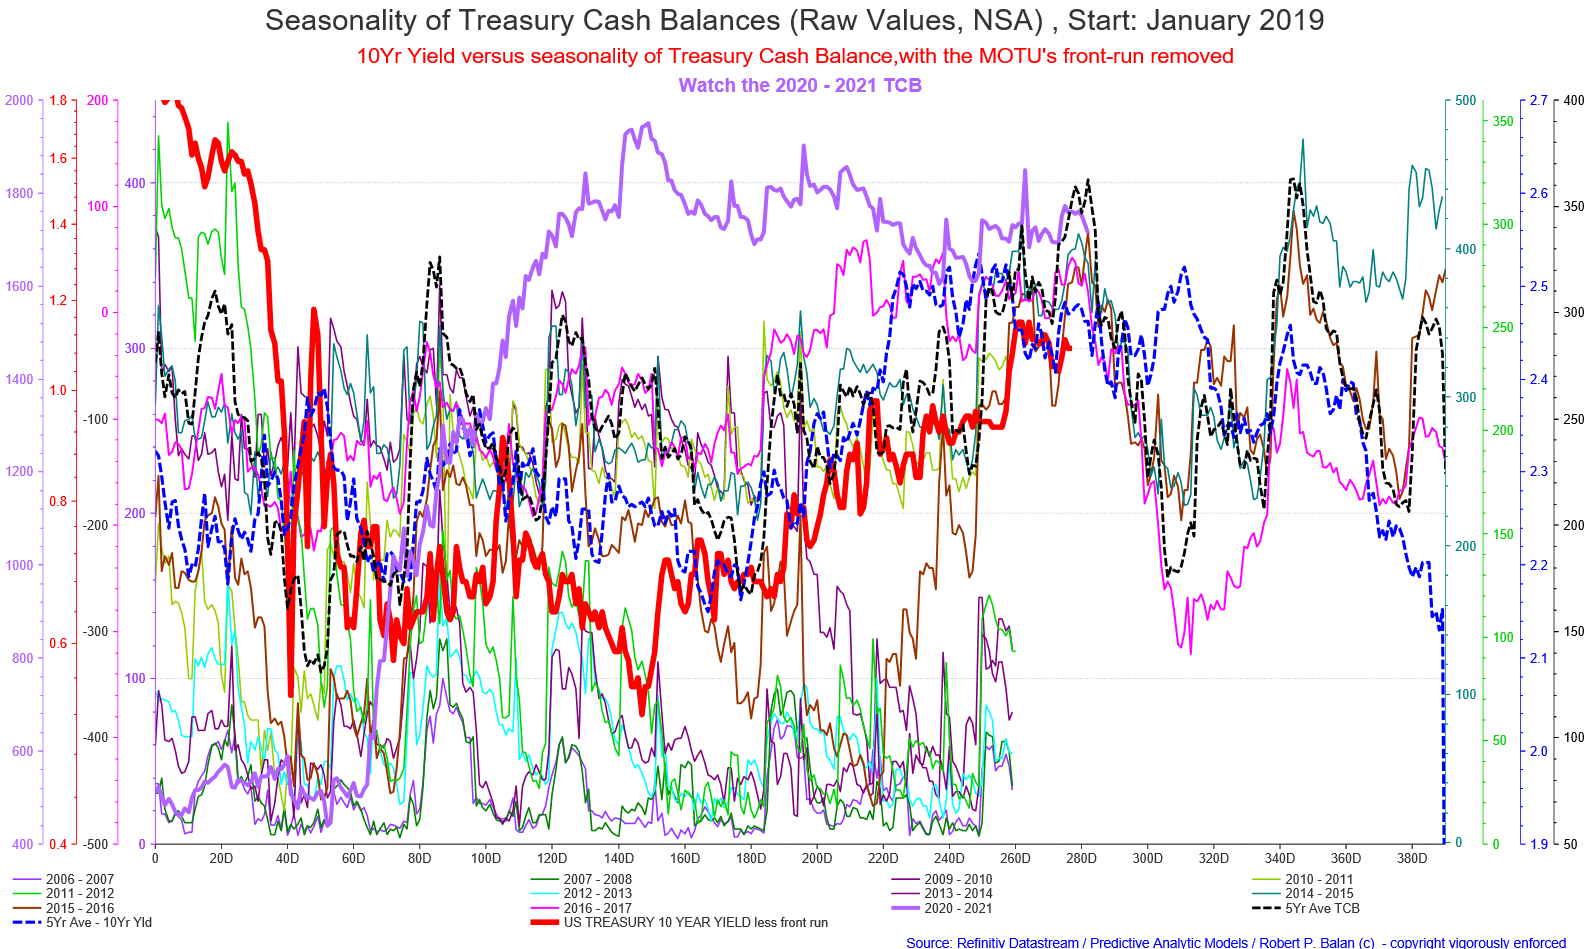
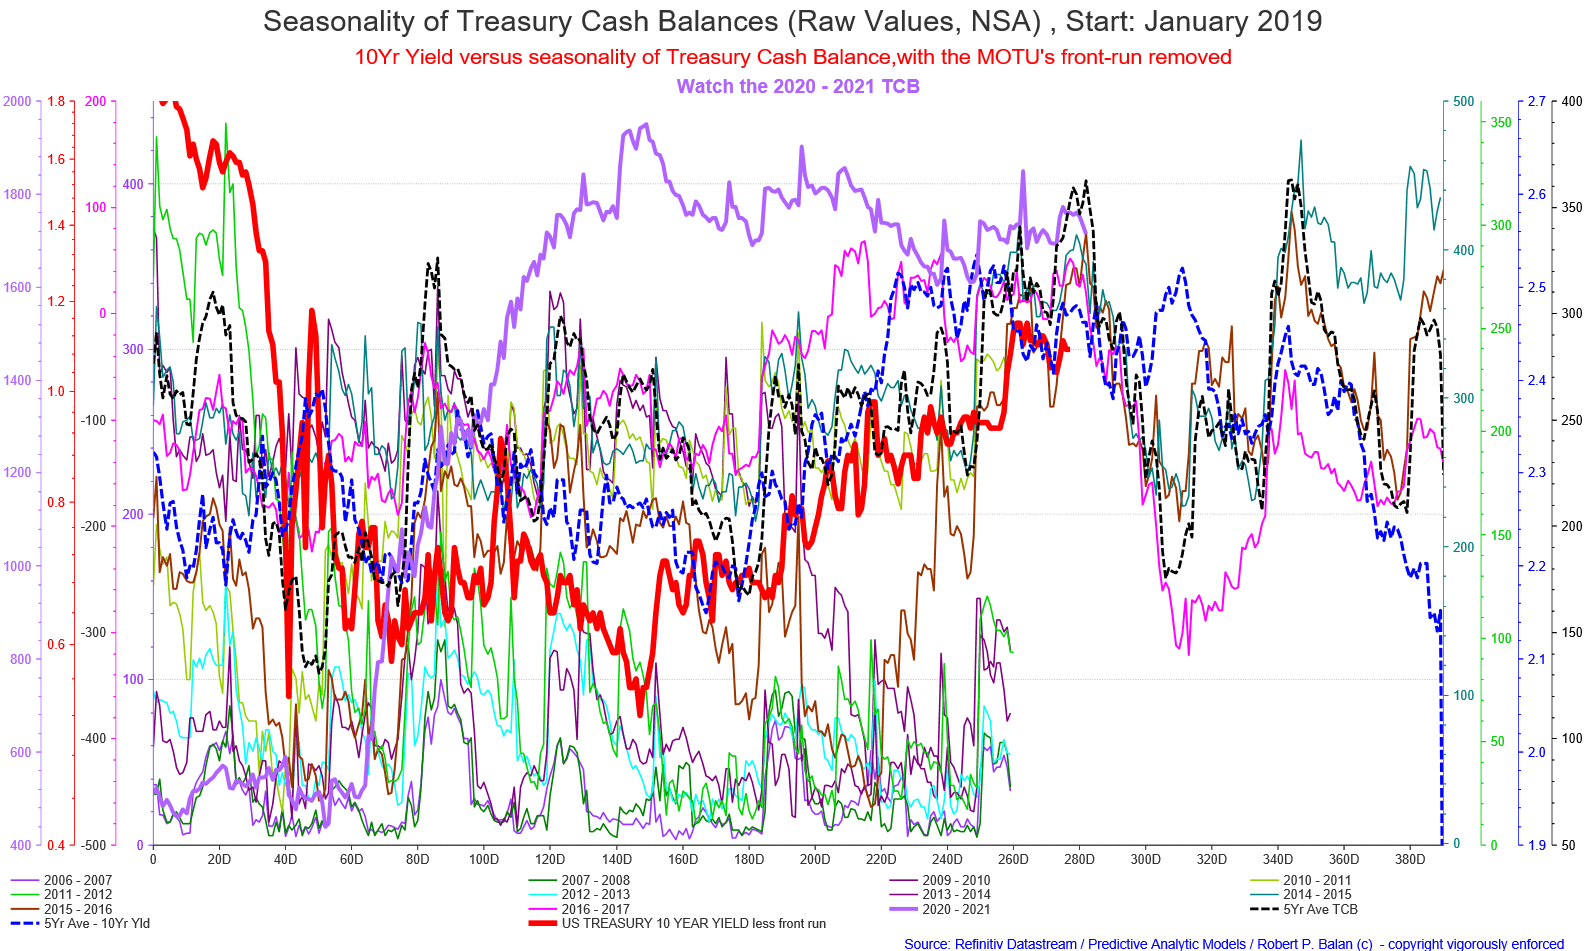
- The Debt Issuance and long term yield covariance flipped in 2003. Prior to September 2003, the correlation between yields and debt issuance was somewhat positive -- that flipped on Sept 2003. From that point on, the covariance between issuance and long term rates became negative. That negative covariance was further enhanced by the QE effect of dampened rates on more money from Treasury and Fed liquidity. We should see long term rates RISING with LESS issuance. The liquidity transmission is through the Treasury Cash Balance, but TCB impact on yields lags behind by one quarter, so often hard to discern.
------------------------------------------------------------------------------------
----------------------------------------------------------------------------------------
Here is the current status of the PAM flagship Swing Fund, which includes open and closed trades.
During the twelve months of 2020, PAM delivered phenomenal real-dollar Hedge Fund trading performance, the best at Seeking Alpha:
PAM's flagship Swing Portfolio, year-to-date (December 31, 2020) delivered $100, 181,522.77 net profit on $11,172,813 margin capital.
Year-to-date performance: 754.20%, on 888-98 win-loss trades.
December 2020 spreadsheet here:
Year to date 2020 spreadsheet here.
--------------------------------------------------------------------------------------
RM13Feb 2, 2021 3:04 PM
I want to see the board's response to this - this affects TCB if true -
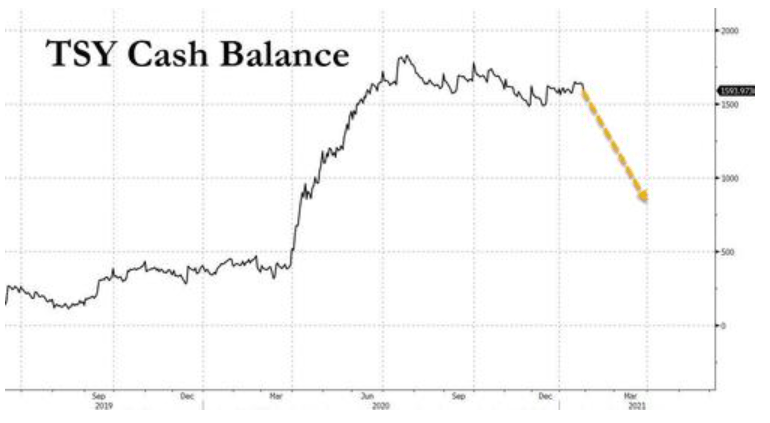
Treasury Now Projects Borrowing $900 Billion Less This Quarter: What That Means For Markets
Some $900 billion in very "bullish" reserves are about to enter the market.
Will we get a 600 mil stimulus or 1,900 mil one? How much issuance has to happen if last one is enacted?
 robert.p.balanModeratorLeaderFeb 2, 2021 3:58 PM
Looks familiar.
RM13Feb 2, 2021 4:16 PM
I look for the degree of disdain to the possibility of corrections in comments. I find that when a) everyone makes fun of that possibility, b) almost everyone states that corrections will not happen again, they happen... Degree of comments suggests we are getting close.. Those who said that social media had no value are clearly wrong
bogeygolfFeb 2, 2021 4:05 PM
https://twitter.com/Mephisto731/status/1356372380898230274
r/wsb had their day. They should cut and go but of course most won't. Every battle now will be a smaller rerun of this, and will be lost, because weekly call options on low float names will be vol++ for the foreseeable. Everyone's remodelled the right tail already. It's gone.
6/n
— MultifractelFarol (@Mephisto731) February 1, 2021
plavacFeb 2, 2021 4:36 PM
"What are the market implications of all this? Well, as Treasury cash balances plunge, banks will see their reserve levels soar by roughly $900 billion this quarter, a move that will lead to significant risk asset upside if previous instances of reserves growth are any indication."
Robert, Zerohedge expects the stock market to rise further this quarter and we expect the stock market to fall
flamarkFeb 2, 2021 4:41 PM
With RTY weakening relative to YM , I'm going to be curious what you choose for your short candidate.
robert.p.balanModeratorLeaderFeb 2, 2021 4:56 PM
Both YM and RTY mark
RM13Feb 2, 2021 5:01 PM
Will we get a 600 mil stimulus or 1,900 mil one? How much treasury issuance has to happen if last one is enacted? just looking at these possibilities. TCB is about 2,600 mil, so there is no real need for more issuance - but would Treasury do so, to grease the financial system?
robert.p.balanModeratorLeaderFeb 2, 2021 5:07 PM
plavac --- ZeroHedge is stupid. -- when Debt Issuance (Total Debt) falls Treasury Cash Balance falls in nominal amounts. It does not mean that Bank Reserves will rise in nominal amount -- it will only rise percentage-wise or ratio-wise to TCB. Bank Reserves and TCB have Yin-Yang relationship, but they are not directly inverse. Bank Reserves will fall too in nominal amounts. BR is not created ab nihilo -- it comes as a consequence of debt issuance. If you lessen issuance, then nominally Bank Reserves will fall too. Its only the RATIO or PERCENTAGE of BR over TCB which will rise in the asset-liability composition of the Fed balance sheet.
artbriskFeb 2, 2021 5:14 PM
BR are not created ab nihilo – they come when the Fed monetises the debt issuance (SOMA) and the Treasury spends its TCB (thus money flowing into private sector/banks?
robert.p.balanFeb 4, 2021 1:00 PM
That's the exact sequence artbrisk
plavacFeb 2, 2021 5:10 PM
Thank you Robert
RM13Feb 2, 2021 5:15 PM
What do lower levels of issuance mean for a) yields and b) dollar?
robert.p.balanModeratorLeaderFeb 2, 2021 5:19 PM
Smaller issuance, smaller TCB. Here is the effect of TCB on the yield.
 robert.p.balanModeratorLeaderFeb 2, 2021 5:20 PM
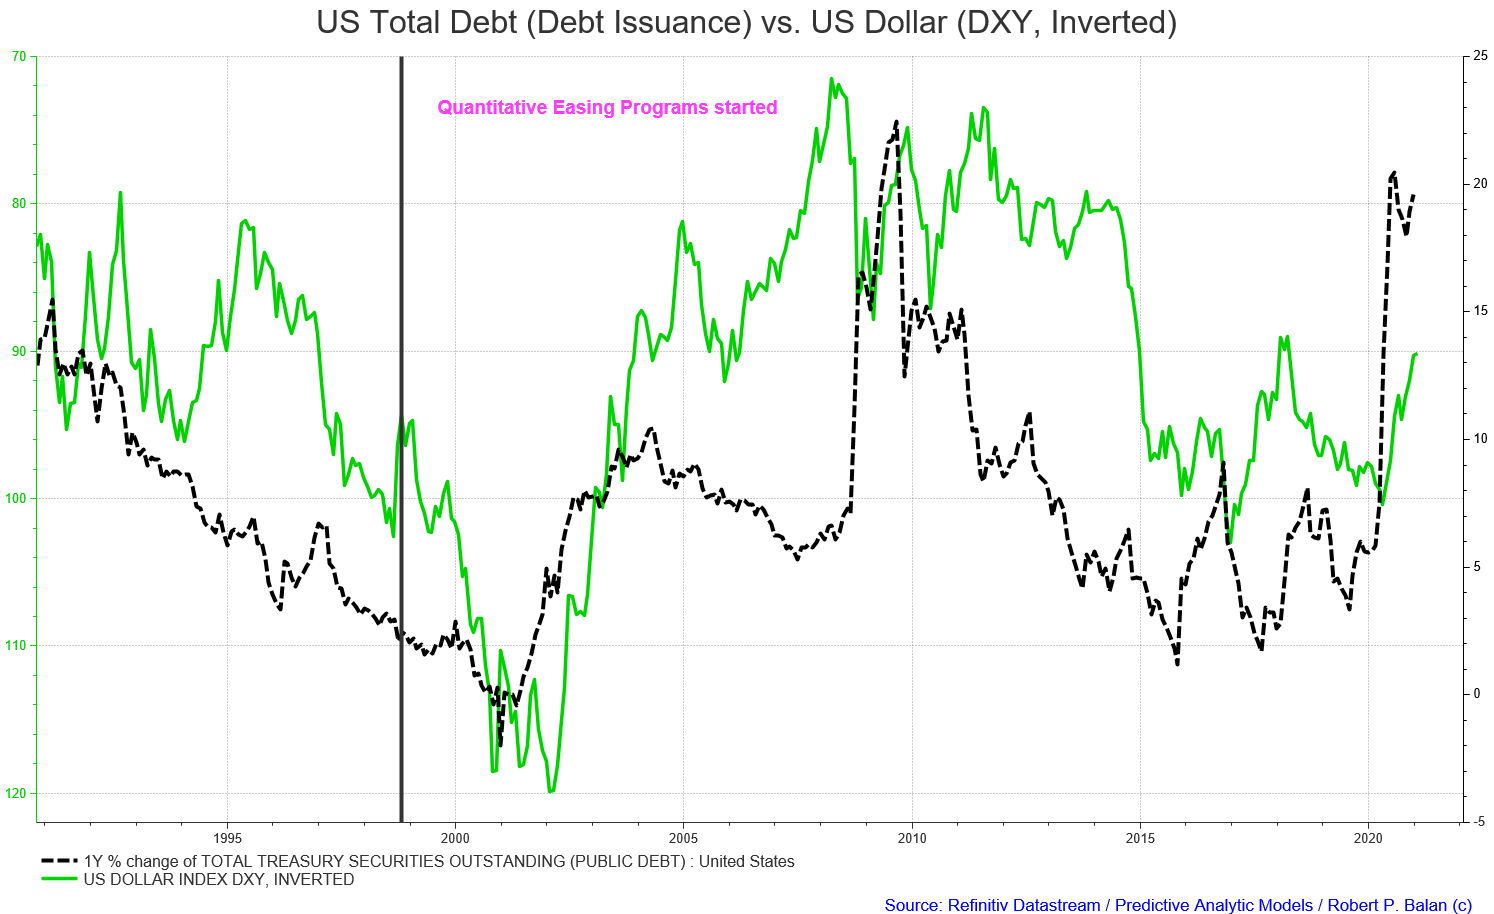
Lower issuance -- stronger US Dollar. let me go look for that dang chart.
RM13Feb 2, 2021 5:21 PM
Thank you, wanted to hear it from the master... Lower issuance would cause problems for equities too.. It's lining up..
robert.p.balanModeratorLeaderFeb 2, 2021 5:23 PM
Yes Rafa because that means smaller bank reserves.
robert.p.balanModeratorLeaderFeb 2, 2021 5:38 PM
Here is the dang chart. DXY (green line) is inverted in the chart.
 crowfeverFeb 2, 2021 5:35 PM
Robert any new target in mind for DX?
RM13Feb 2, 2021 5:39 PM
Robert, too many are short dollar right now.. Unless uber stimulus forces large issuance, dollar will move up...
robert.p.balanModeratorLeaderFeb 2, 2021 5:40 PM
Crow -- if the Biden government cuts debt issuance by a fourth, at least 120 in the DXY.
robert.p.balanModeratorLeaderFeb 2, 2021 5:56 PM
plavac -- OK here it is.
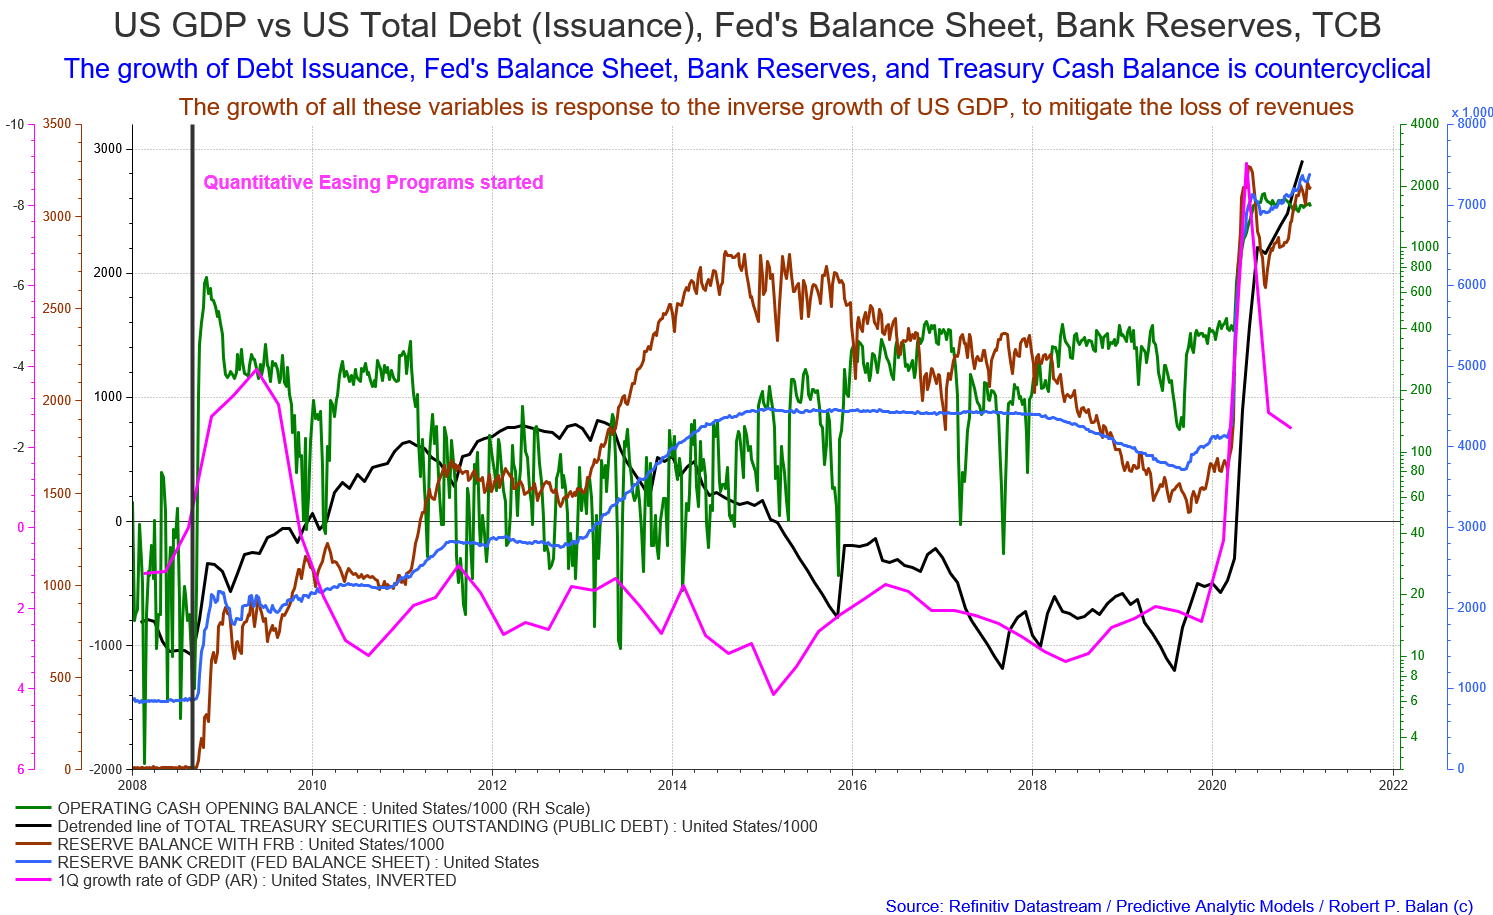
The growth of Debt Issuance, Fed's Balance Sheet, Bank Reserves, and Treasury Cash Balance is countercyclical.
 robert.p.balanModeratorLeaderFeb 2, 2021 5:57 PM
TCB and Bank Reserves grow only when debt issuance and Fed balance sheet are growing. As @artbrisk noted, BRs are created when the Fed monetizes the debt issuance, and the TCBs is disbursed to recipients.
centexlifeFeb 2, 2021 5:58 PM
Must not forget that the next round of Stimulus may not include direct payments, may only include unemployment extensions, and may focus on programs to stimulate employment deemphasizing stimulating Wall Street. Time period March ~ May. Such were the discussions yesterday at Hedgeye with Danielle DiMartino Booth. No apatite remains for direct payment as those past payments did not stimulate employment. The last stimulus spent within 10 days per Treasury (paying off credit cards, option plays on Robinhood ... ).
RM13Feb 3, 2021 5:50 AM
For the link to discussion, it's always entertaining - Hedgeye Risk Management | WEBCAST | McCullough & DiMartino Booth: America's House Of Cards
robert.p.balanModeratorLeaderFeb 2, 2021 5:59 PM
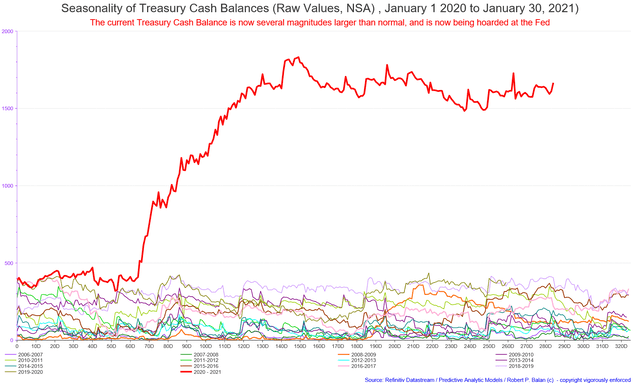
If we have growth in Q3, there will be less issuance .. anyway there is still circa $1.594 trillion cash in the TCB -- hence the announcement that they will issue less debt makes sense.
robert.p.balanModeratorLeaderFeb 2, 2021 6:08 PM
My turn to ask -- if there is less debt issuance, what happens to bond yields?
john.derFeb 2, 2021 6:16 PM
Goes down
RM13Feb 3, 2021 5:52 AM
Agree, yields go down..
robert.p.balanFeb 4, 2021 1:40 PM
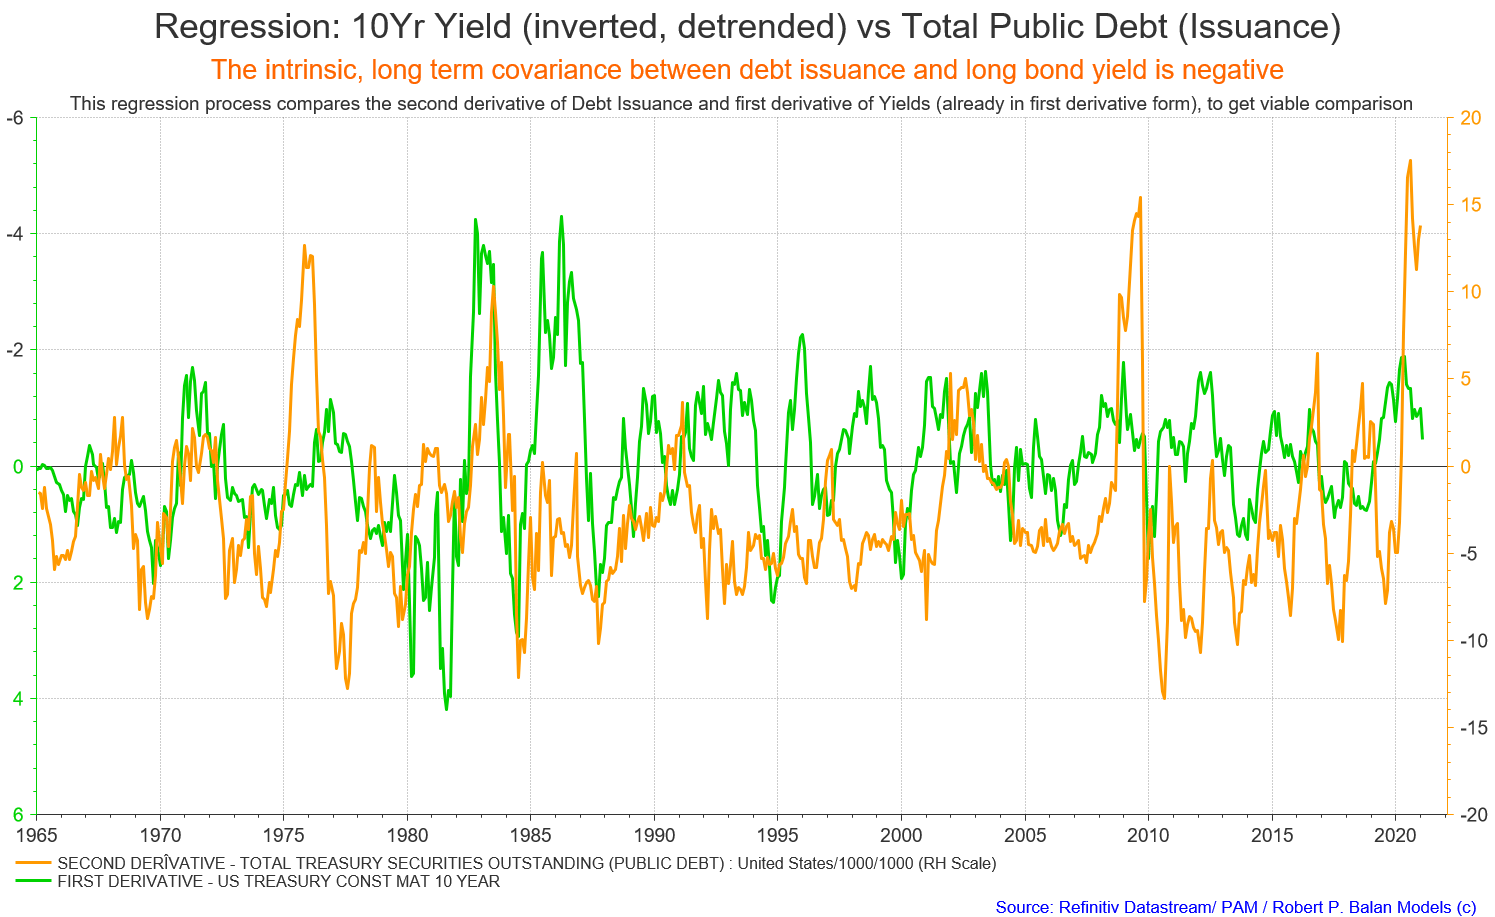
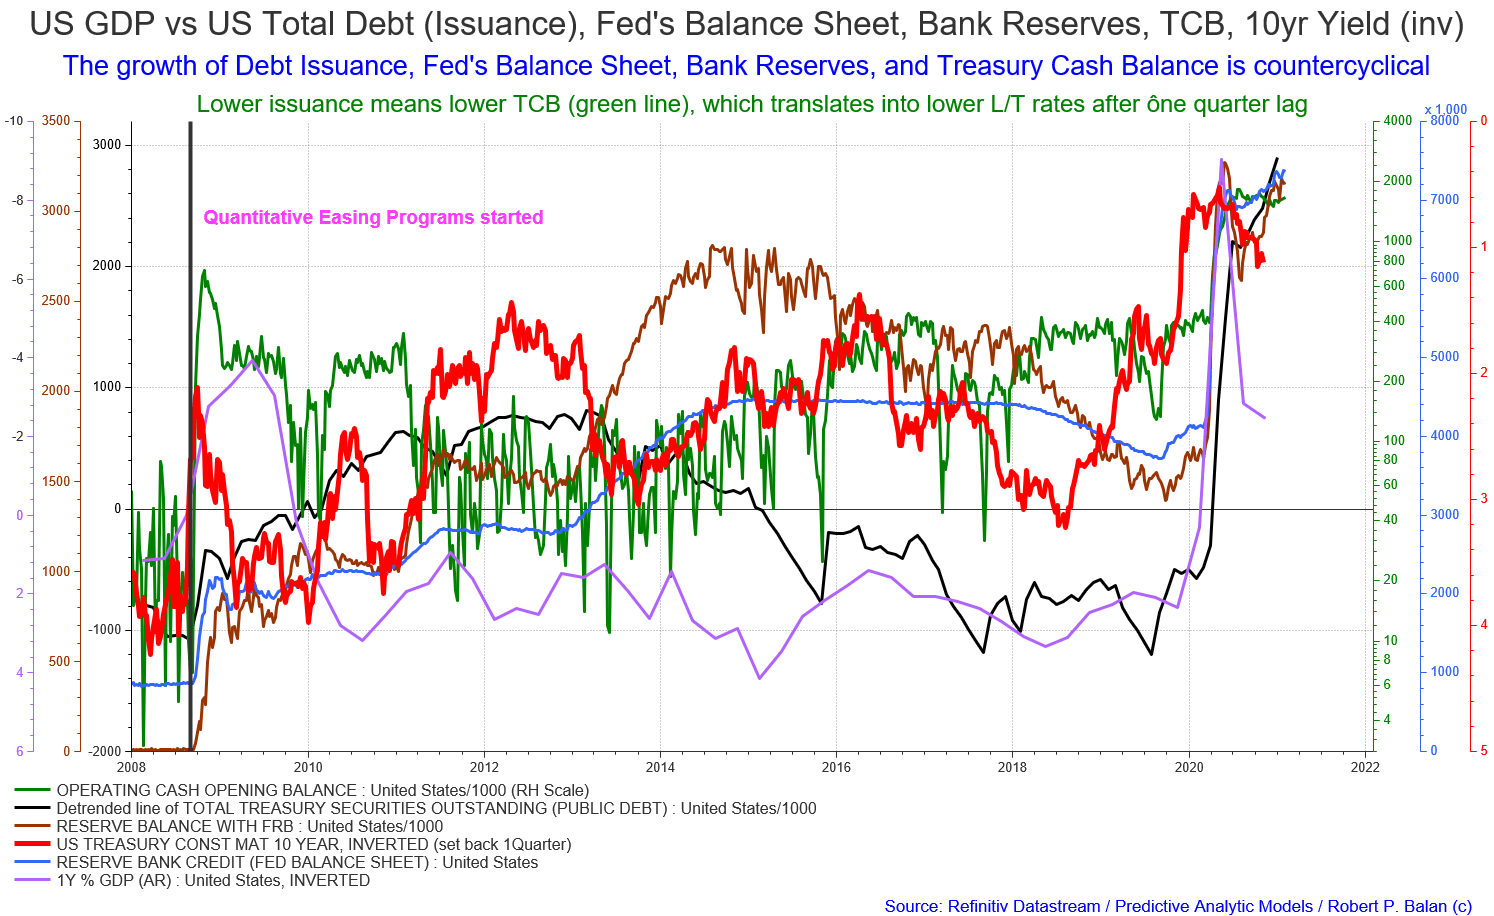
Actually a tough call -- but the intrinsic, long term covariance between debt issuance and long bond yield is negative (see chart below).
 You can so see the long term relationship in this LT chart with GDP (chart below).
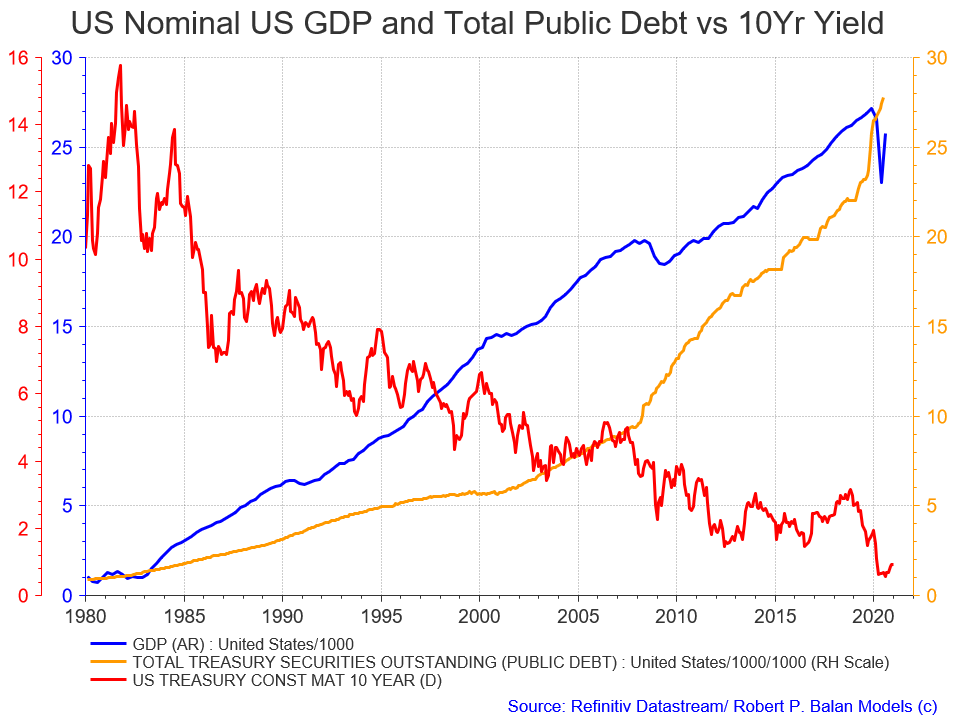 Actually the covariance flipped in 2003. Prior to September 2003, the correlation between yields and debt issuance was somewhat positive -- that flipped on Sept 2003. From that point on, the covariance between issuance and long term rates became negative.
That negative covariance was further enhanced by the QE effect of dampened rates on more money from Treasury and Fed liquidity. We should see long term rates RISING with LESS issuance (see chart below). The liquidity transmission is through the TCB, but the impact lags behind by one quarter, so often hard to discern.
Alan.LongbonFeb 2, 2021 6:08 PM
You can sort of work out how much "debt" issuance there will be and also how much of it will be bought up by the Fed. In a perfect scenario, the mainstream Washington consensus is that the Fedgov issues debt and it is all bought up by the private sector as an asset swap, the Fed buys none of it and it looks like the Fedgov is borrowing from the public.
There are some fixed private buyers of treasuries and that is the recipients of export income from the USA who are forced to either sit in cash or buy treasuries for some income. That is about $50B per month or $500B per year.
Whatever is issued over that amount is either bought by the US private sector or failing a buyer it is bought up by the Fed as a last resort. In the UK for example, just about all the new debt is bought up by the Central Bank as there is no other alternative. So if Biden spends $1.9T in one year, $500B will be bought by the USA's export partners and the rest will have to be bought by the private sector and if that is not large enough the Fed will have to step in and buy it whether they want/plan to or not.
And as RB points out above, chances are they plan to spend the contents of the TCB and bring that down to a "normal" level of $200B to $400B. The way the system is wired one cannot spend and not buy treasuries at the end of the day if the Fed is to maintain its target interest rate. Fedgov spending has a one-month knock-on effect on markets
TimK123Feb 2, 2021 6:09 PM
Good discussion. Being fairly unknowledgeable I found this helpful to explain what might happen:
“Treasury will keep everything steady this meeting, using it as an opportunity to take stock of things,” said Priya Misra, head of global rates strategy at TD Securities. “They came into the year over-funded and need to bring the cash balance down anyway. Treasury also wants to keep their flexibility as there could be $1 trillion more in stimulus, or no more at all.”
FEBRUARY 3, 2021
GOOD MORNING EUROPE / GOOD EVENING WEST COAST
robert.p.balanModeratorLeaderOwnerFeb 3, 2021 9:13 AM
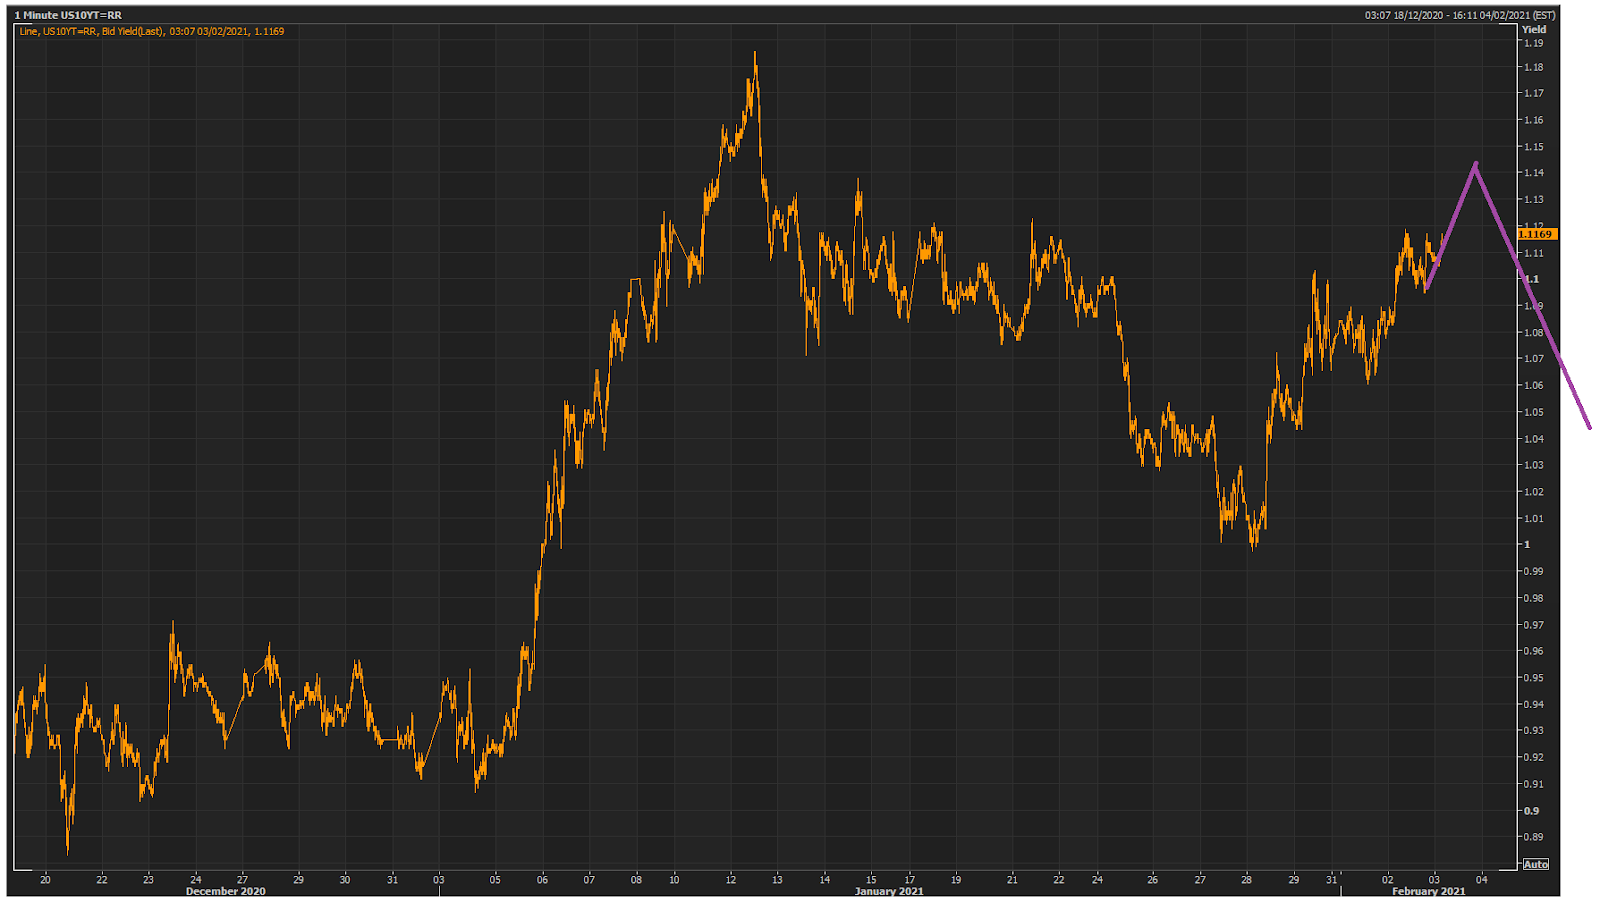 It looks like we will still see that yield rally to 1.15.
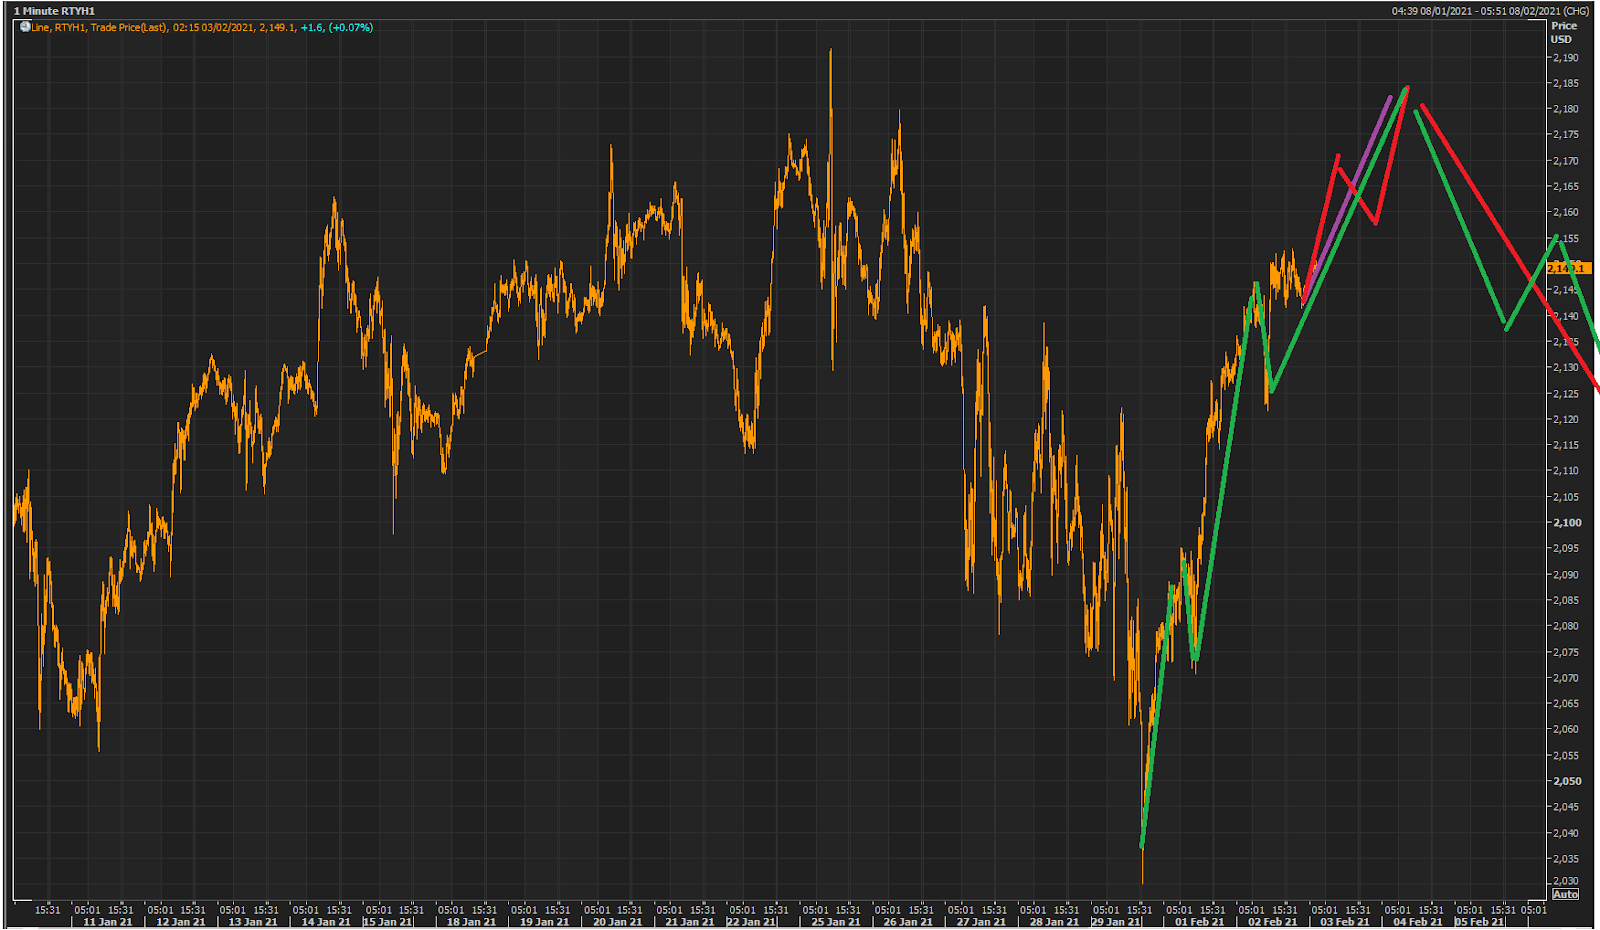 That allows a completion of five wave sequence from Monday Asian low in the indices.
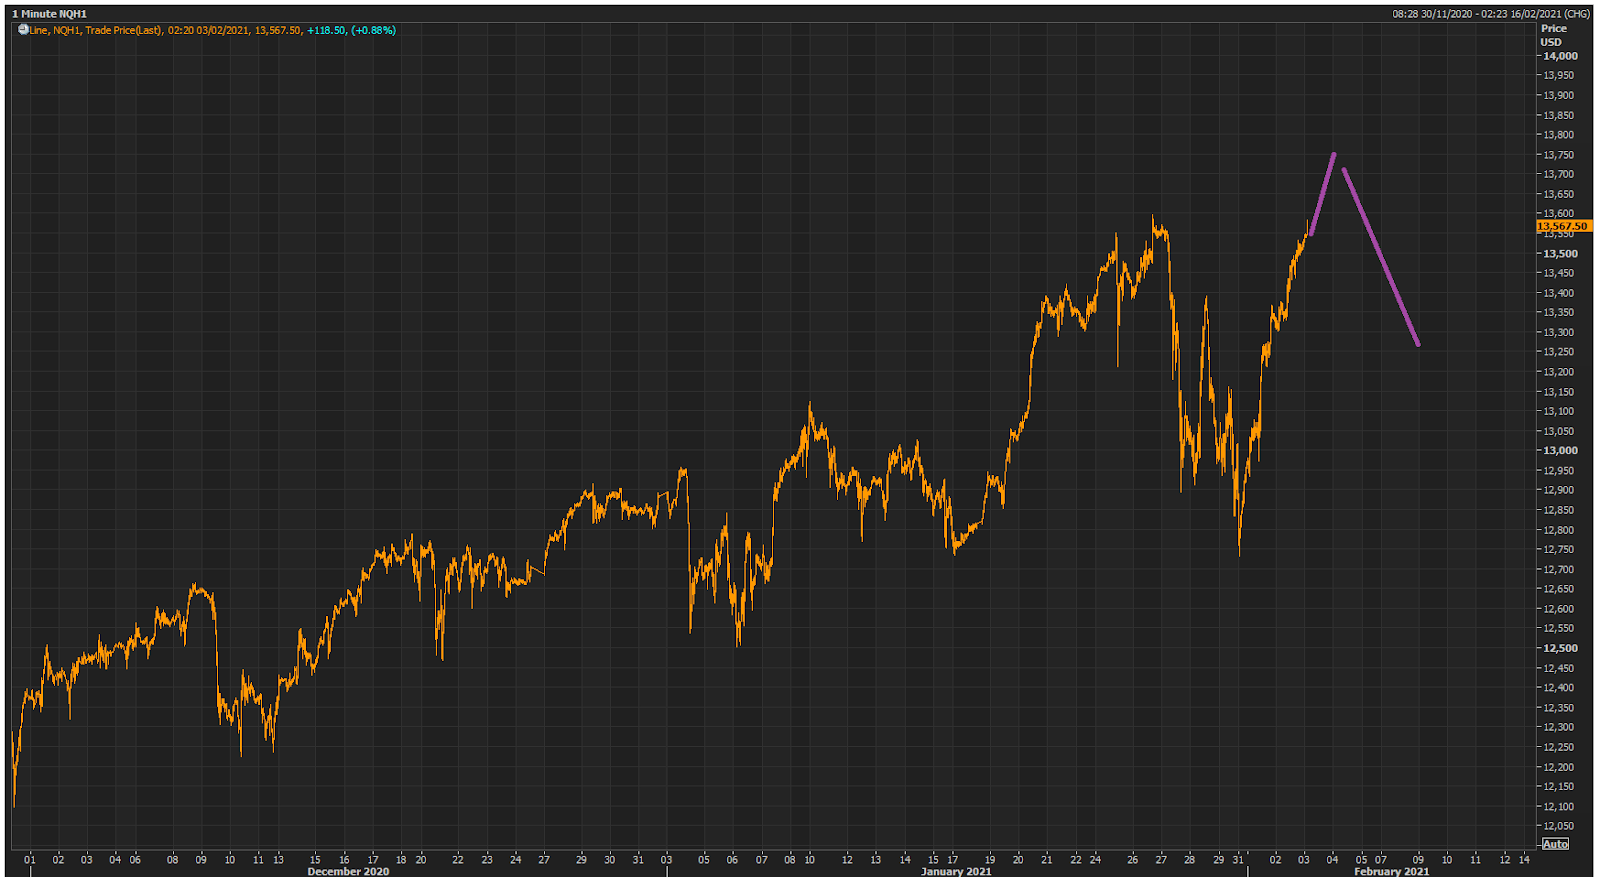 It also means NQ will probably make a new higher high. And that dims the prospects that we are looking at a Wave 2 framework in the equity indices.
 bogeygolfFeb 3, 2021 2:42 PM
what caused bank credit (green) to tick higher?
robert.p.balanFeb 3, 2021 3:08 PM
The fed added to its balance sheet.
Our yield model still tells us we have at least another trading week of rising yields.
Therefore we resume scalping first small punts to the downside, and then bigger scalper bets on the way up.
What has surprised me (personally) is that given the outperformance of both AMZN and GOOGL, the NQ did not unleash a tidal wave.
The models tells us yields should be higher, but we are now just left with Mr. Biden's stimmy initiative to goose up stocks higher. The problem with that is the issue has been discussed to death, the market has already internalized a large part of that news event, and if the final stimmy numbers disappoint, we will initiate a pullback.
Moreover, the GameStop saga has sensitized Hedge Funds and CTAS so much that these mini-MOTUs now scramble to delever/degross at the faintest whisper of possible short squeeze engineered by the Reddit meme traders.
If most of the good news has been more than priced in (for instance, the market has internalized a 1.2Trillion stimmy bill at least) -- what happens if we get some bad news? Like a $900 billion stimmy bill -- which does not leave much powder for another set of short squeezes?
robert.p.balanModeratorLeaderOwnerFeb 3, 2021 9:52 AM
Of course, the market can rise further on sheer momentum, and that is what we probably have to rely on. Slim underpinnings, but we will be extra careful (but not too very careful -- that is how we missed this humongous rally).
G5 (US,EU,JPN,CHI,CHF) central bank balance sheets (US$) vs Volatility Indexes
There's negative comovement between Volatility vs central bank provided systemic liquidity.
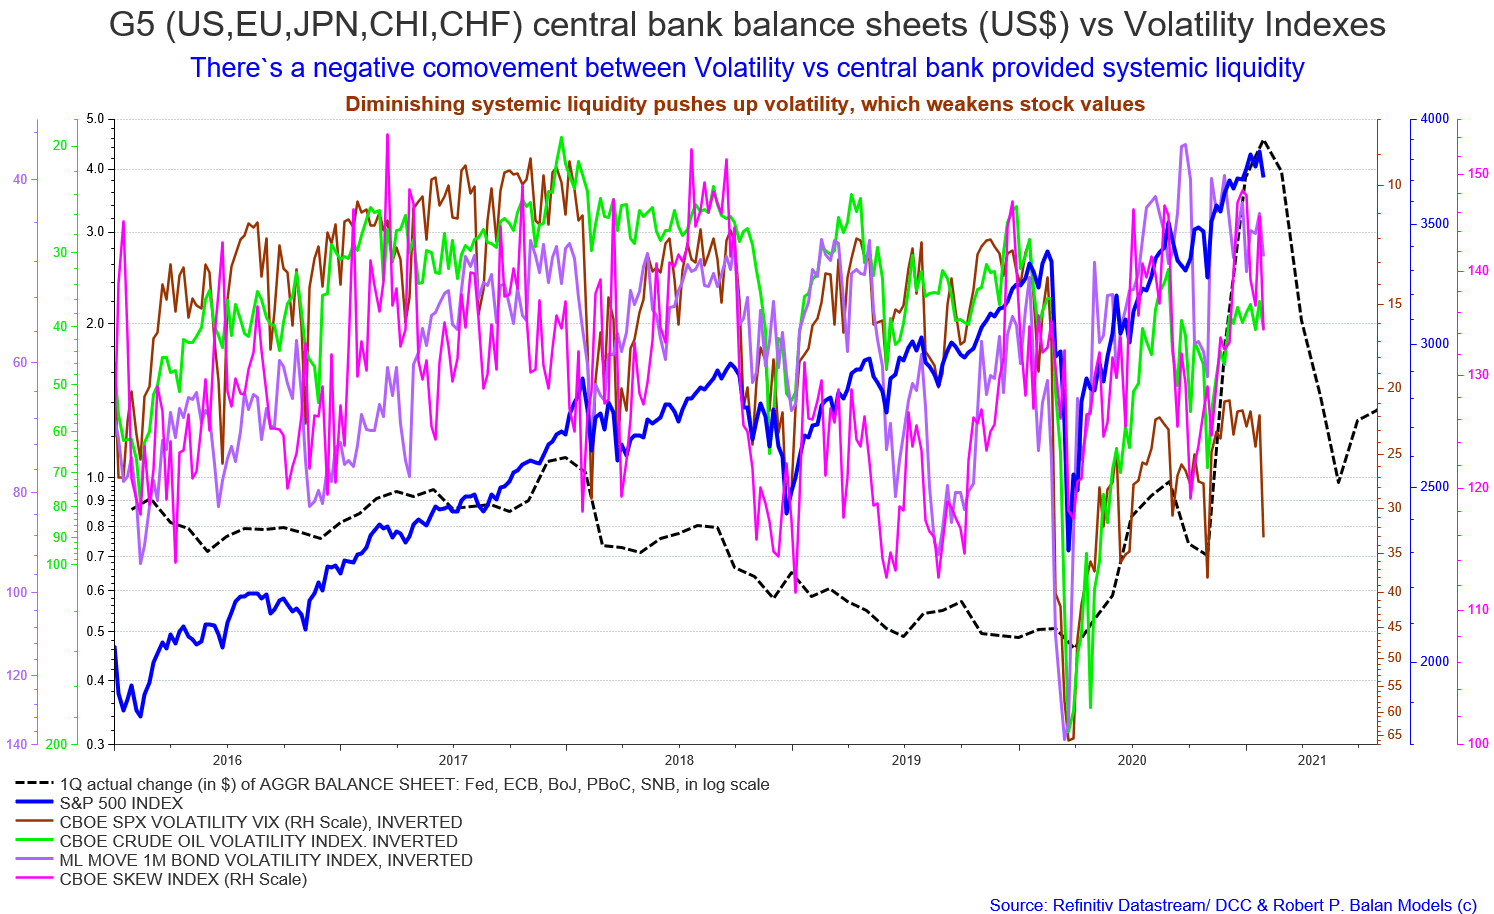 Based on this measure, the Crude oil vol OVX is too low -- oil price is too high. There should be a repricing lower in crude oil prices, very soon.
RM13Feb 3, 2021 3:52 PM
That's a very good observation Robert... In past 2 spikes in OVX, OVX bottomed at about 32-33 region.. I haven't looked when does the spike in OVX co-align with oil sell off..
FEBRUARY 4, 2021
GOOD AFTERNOON ASIA / GOOD EVENING WEST COAST
kiraninvestorFeb 4, 2021 3:37 AM
robert.p.balan The read only Trade Summaries channel does not have any trades posted for this week. Is that correct
khiem.trungFeb 4, 2021 5:09 AM
there is trade summary here too: SWING Portfolio: Open Trades
robert.p.balanModeratorLeaderOwnerFeb 4, 2021 6:10 AM
That's right KI - no trades done this week.
We are seeing some divergence between yields and equity futures today.
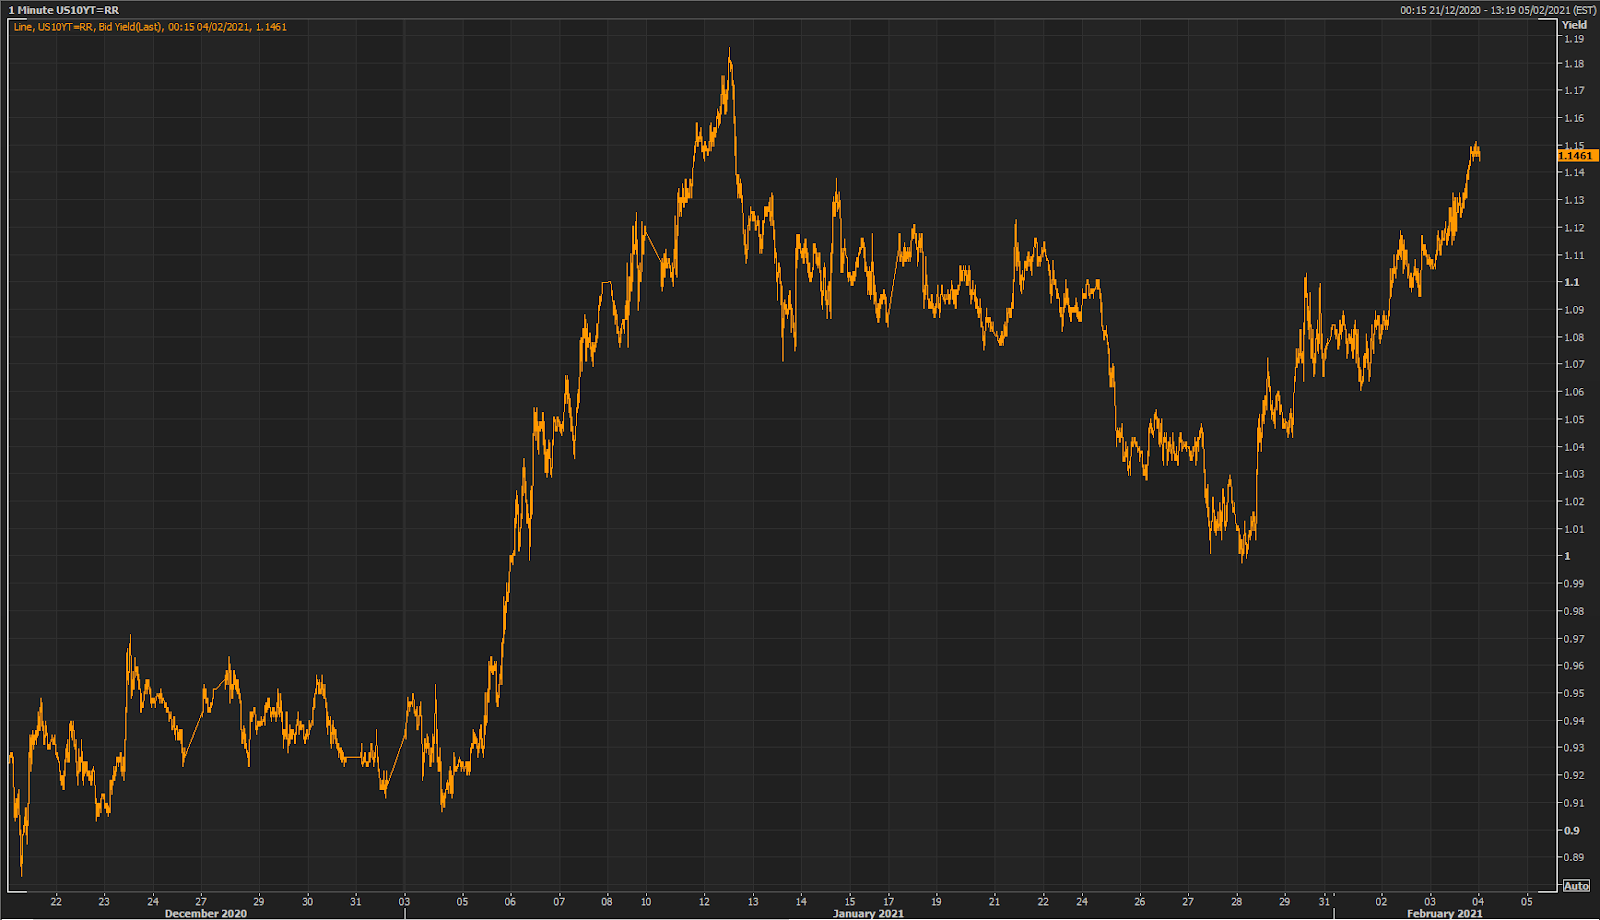 Yields are still rising, as expected . . .
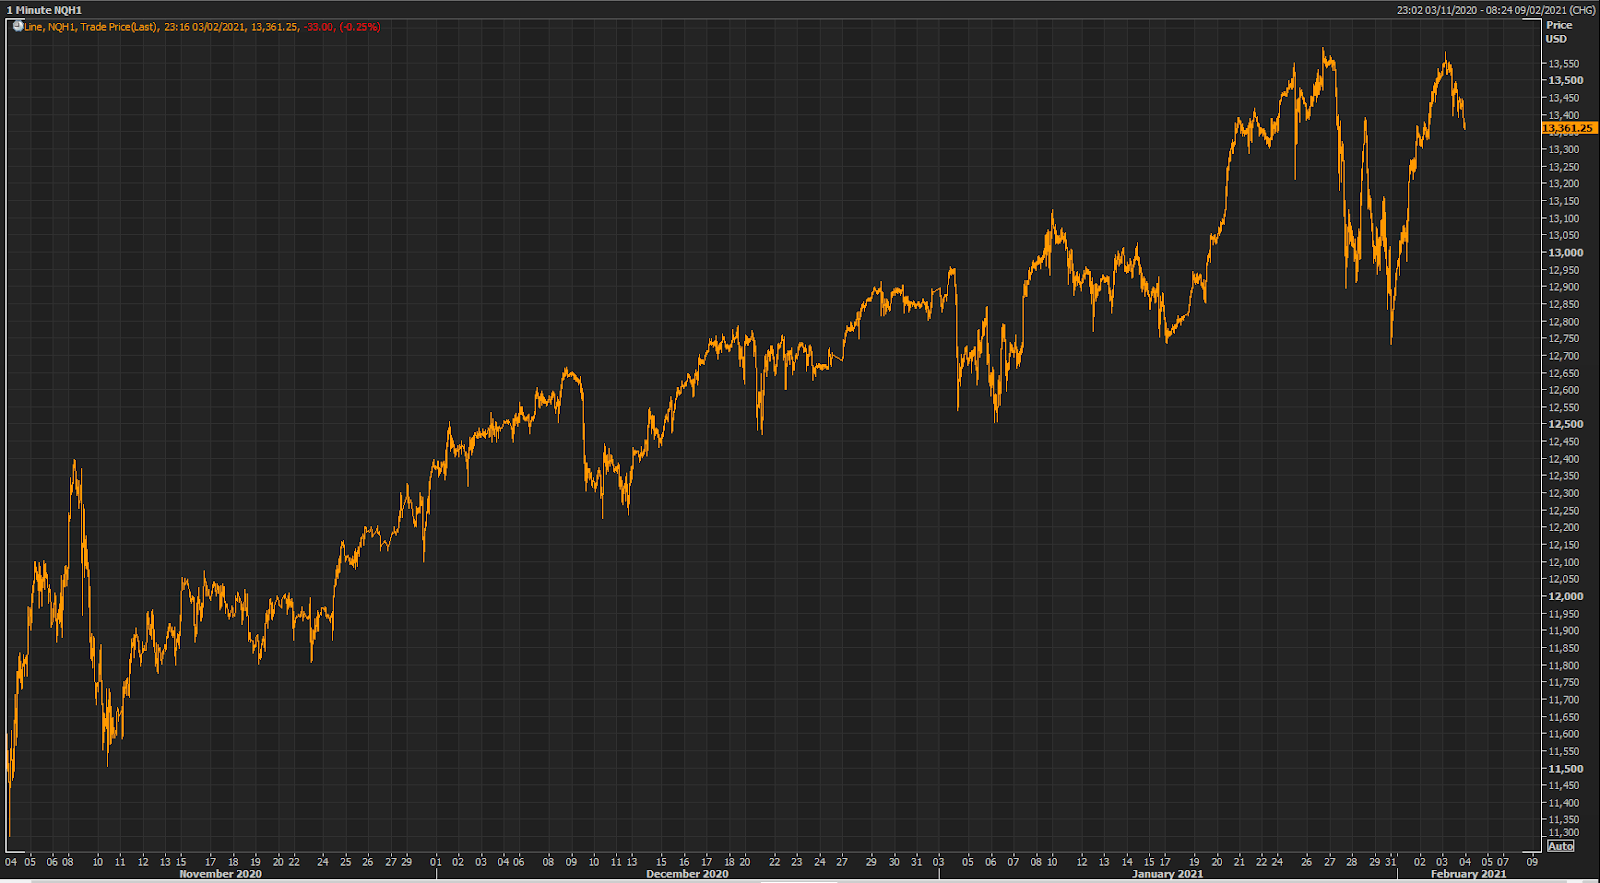 But equity futures are falling in varying degrees.
 If you look closely into the current behavior of yields vis-a-vis the current performance of the Treasury Cash Balance, we should be seeing a two day pullback from yields (pm NY close basis).
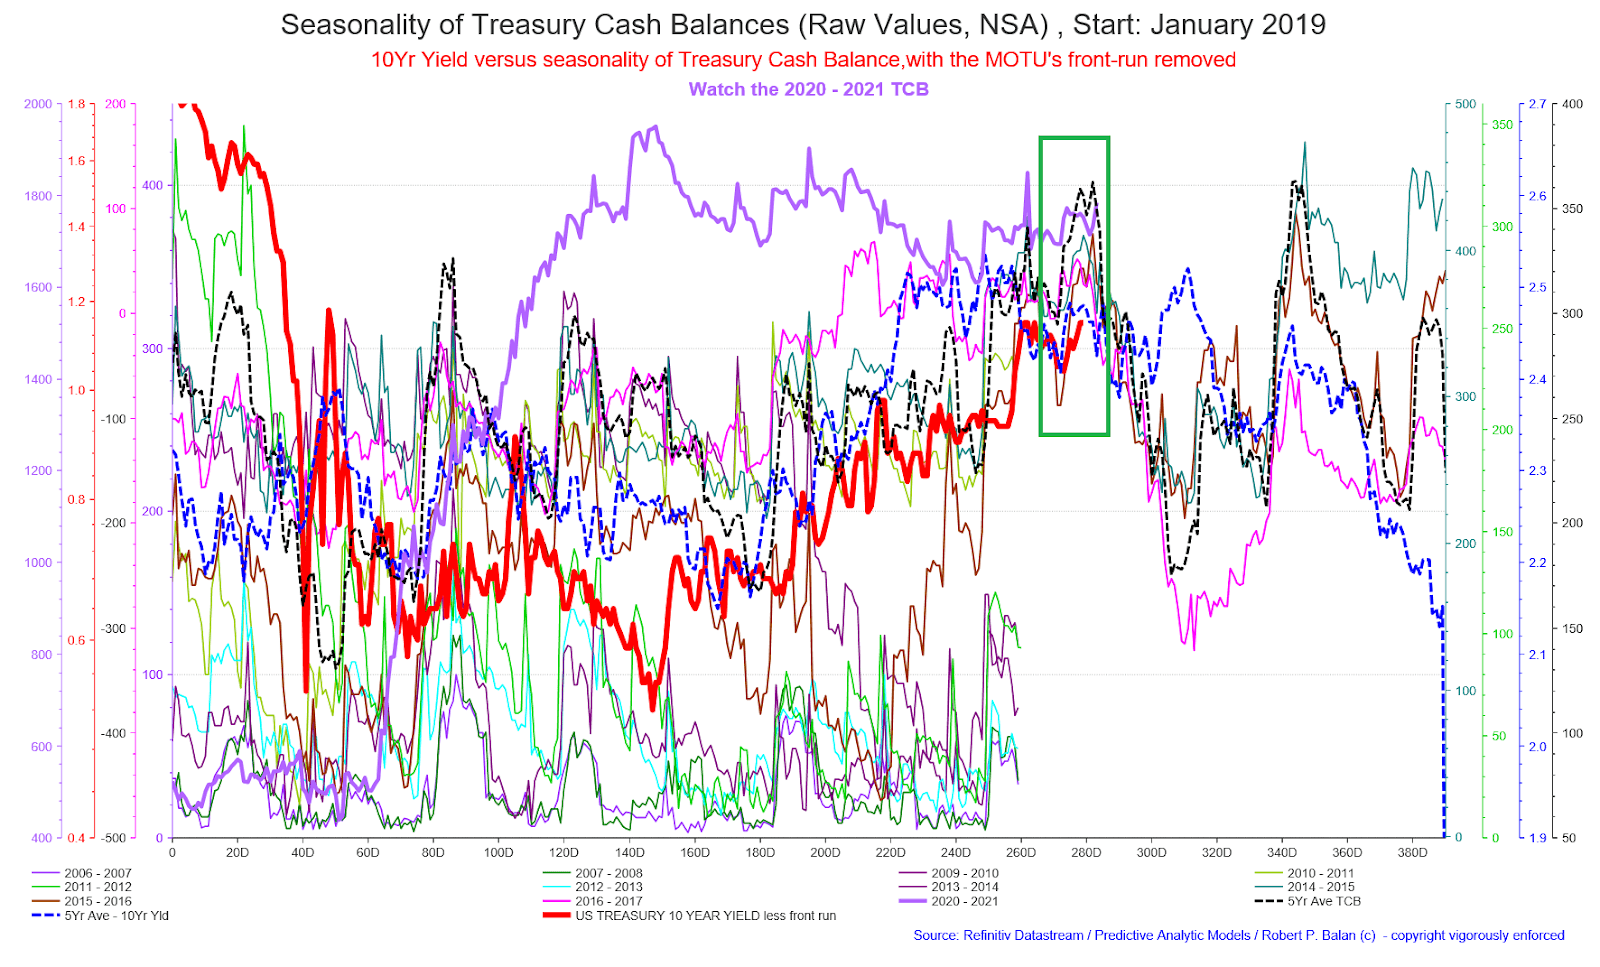 So its likely that we will see equities pulling back some more.
But the current TCB also has risen for two days after that pullback and has not shown topping behavior so far. So we may have a two day pullback in equities, and then at least two days of rally thereafter. That's what the 2021 TCB behavior is providing us so far -- in the case of yields.
There are of course two issues to watch -- (1) that the yield will continue to mimic the 2021 TCB moves on a lagged basis, and (2) more crucially, equities will continue to follow the lead of yields.
And so far equities have been falling and may do so for another day or so.
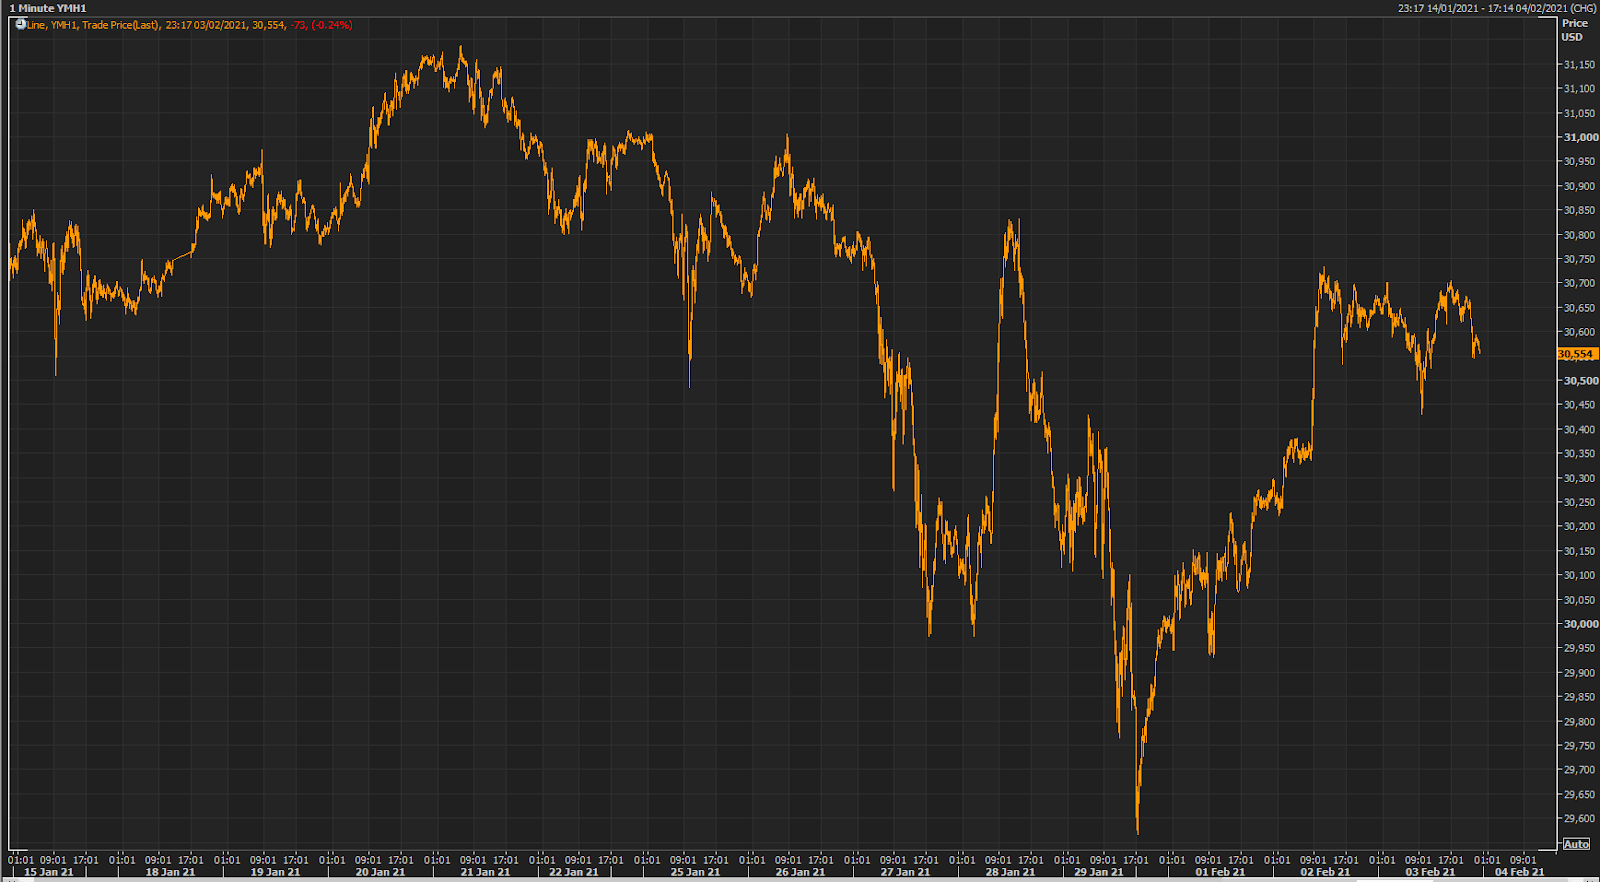
 If I may illustrate those possibilities, this may be what to expect from, say, YMH1. I won't preclude a longer +C+ wave tail.
So we are looking to scalp to the upside -- the downside potential seems small, But that should not stop you from shorting if you are nimble. We are not, as we have to consider the tail-end effect of our trade decisions on the much larger Joint Acct fund.
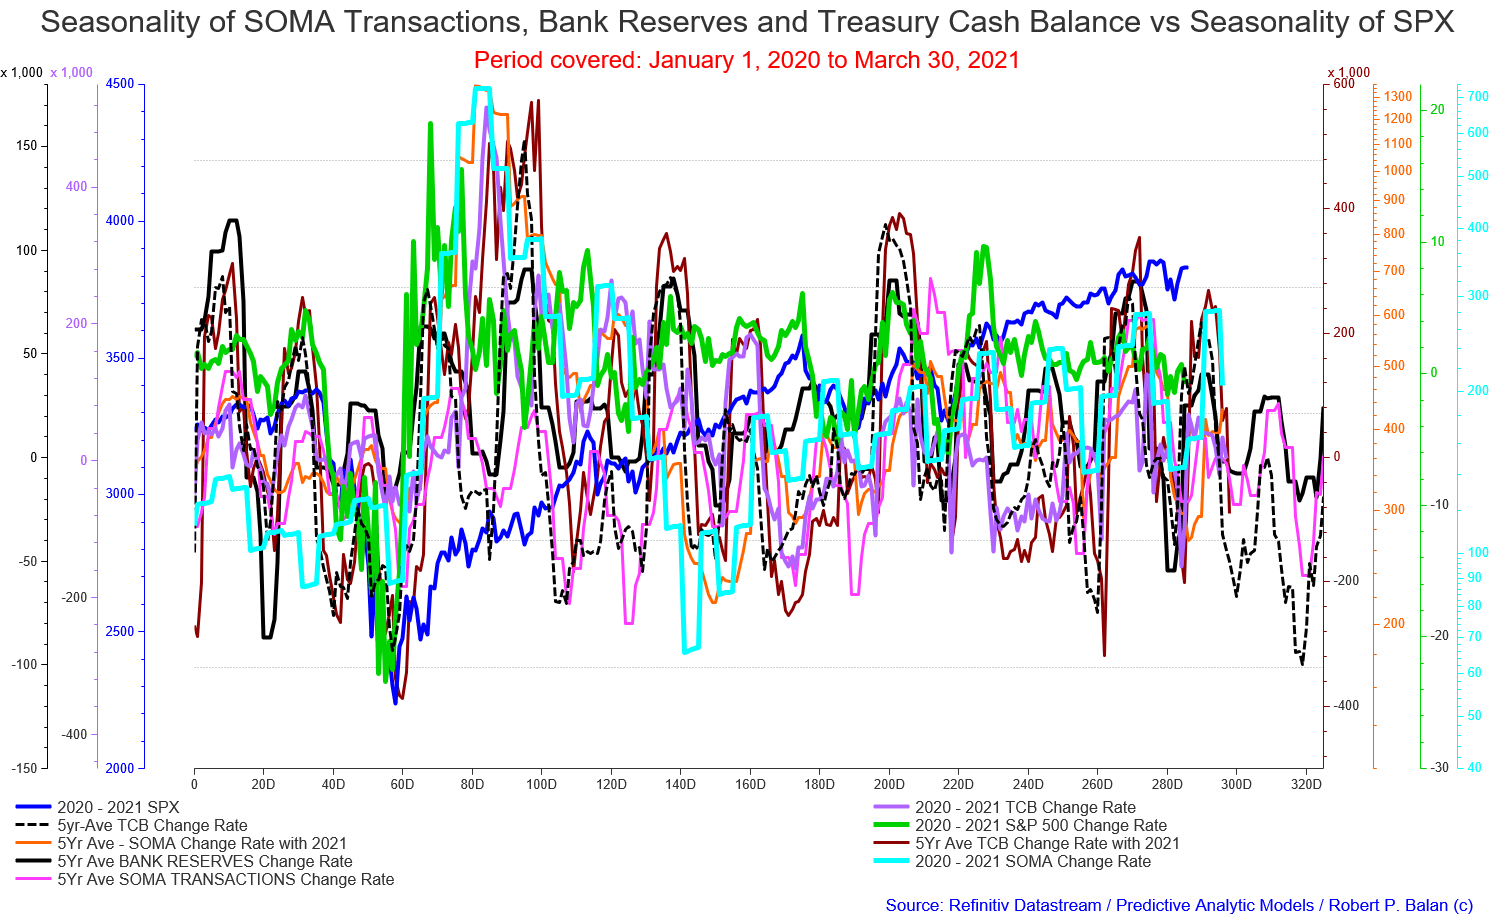 We see the same broad strokes of equities in the model above. Optimal top is 5 to 6 trading days from today.
spitzbubchenFeb 4, 2021 6:17 AM
GC is now below 1830. Any plans to drop the 1833 hedge?
robert.p.balanModeratorLeaderOwnerFeb 4, 2021 7:05 AM
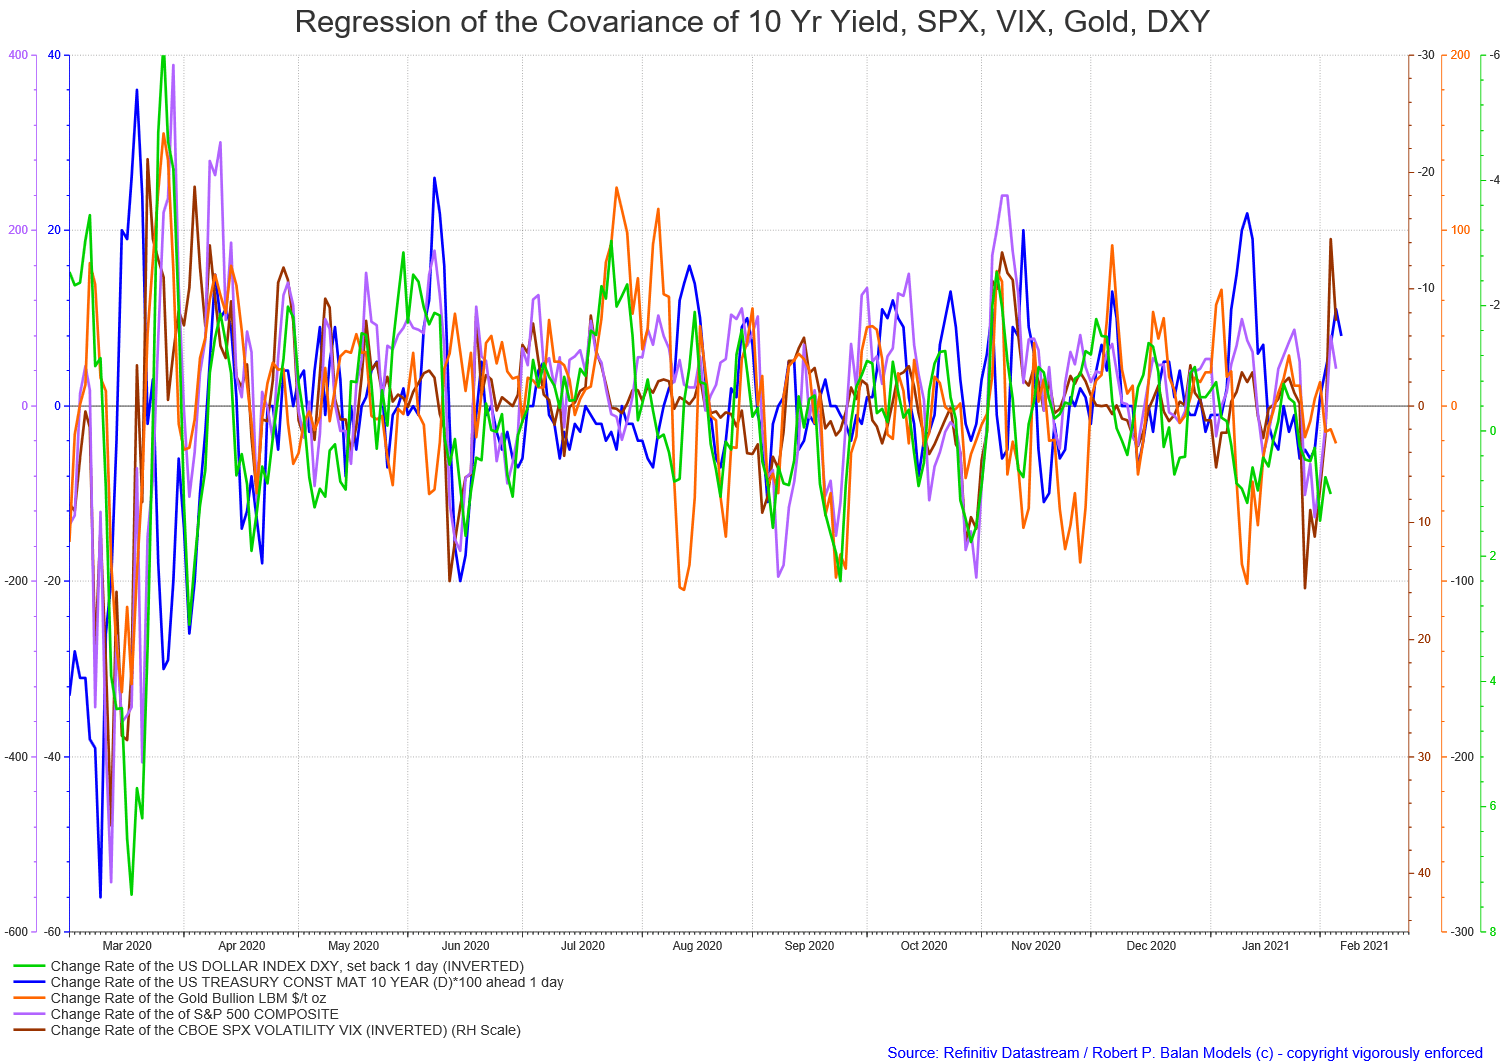
The covariances of the major assets have become aligned again -- so rising yields may see rising equities and rising gold, and falling VIX and DXY.
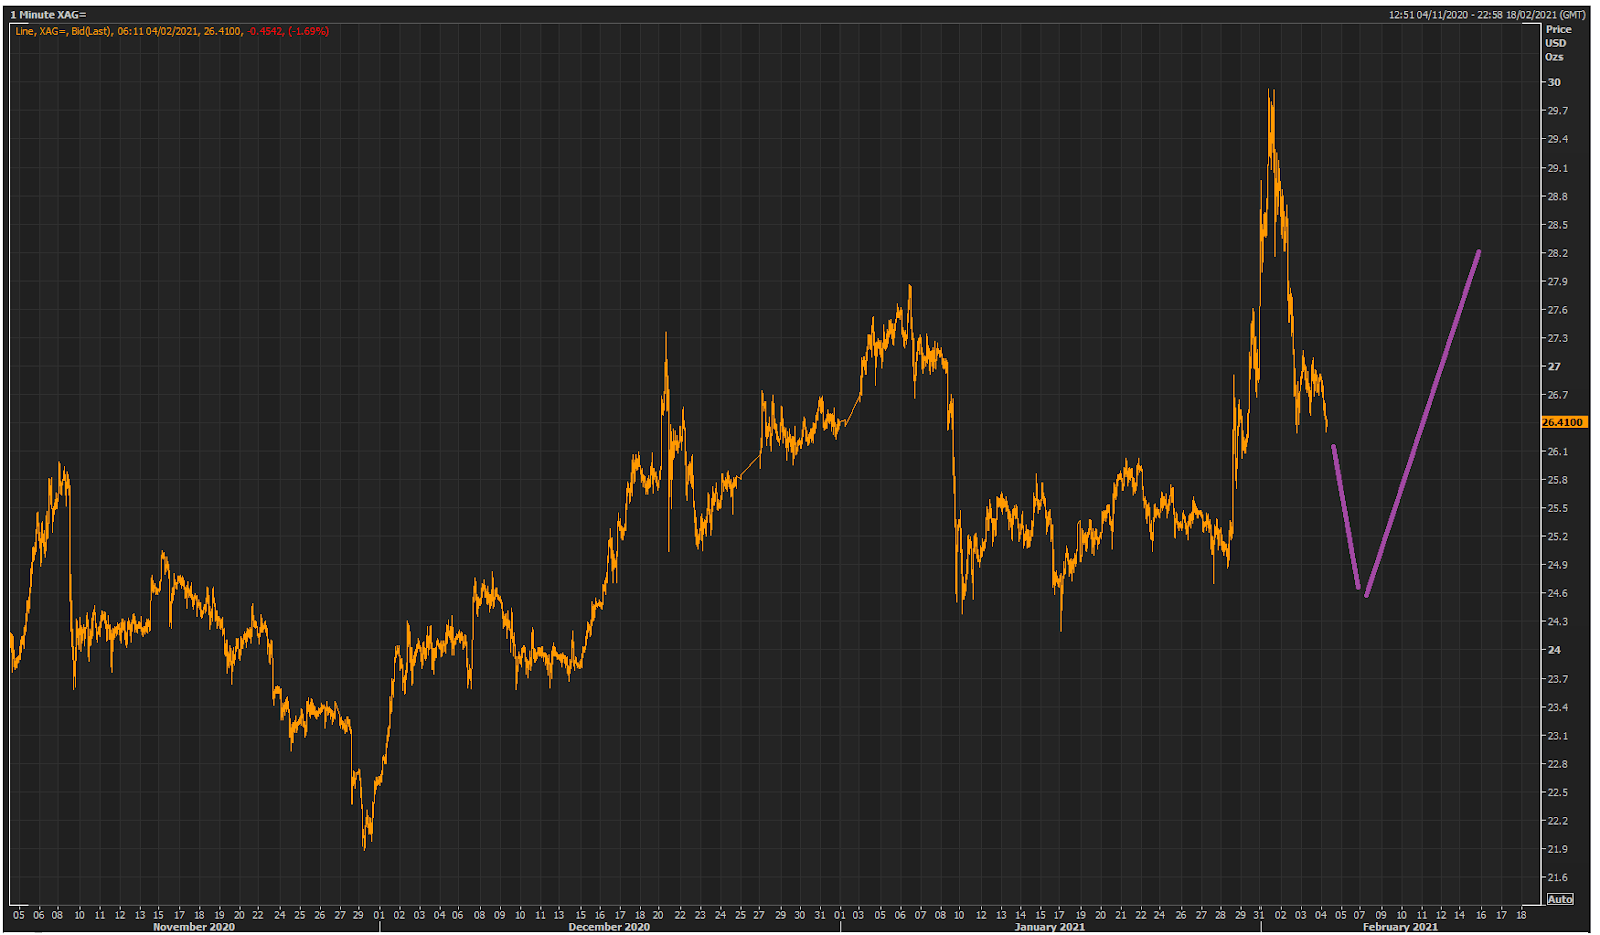
spitzbubchen -- we may see more declines in gold if equities fall some more. So yes, we will exit the short hedges, but also allowing for more declines in GC due to more silver declines.
 robert.p.balanModeratorLeaderOwnerFeb 4, 2021 7:18 AM
See u later at Europe opening.
The covariances of the major assets have become aligned again -- so rising yields may see rising equities and rising gold, and falling VIX and DXY.
 gwizz1Feb 4, 2021 9:28 AM
DXY inverse correlation broke with equities, are you saying that it’s now correlated again robert.p.balan ?
robert.p.balanModeratorLeaderOwnerFeb 4, 2021 11:06 AM
Unless the chart is lying, yes. Remember, these are reckoned on NY close to NY close basis.
h.jabs Feb 4, 2021 10:03 AM
Rising Inflation Will Force the Fed's Hand
robert.p.balanModeratorLeaderOwnerFeb 4, 2021 11:54 AM
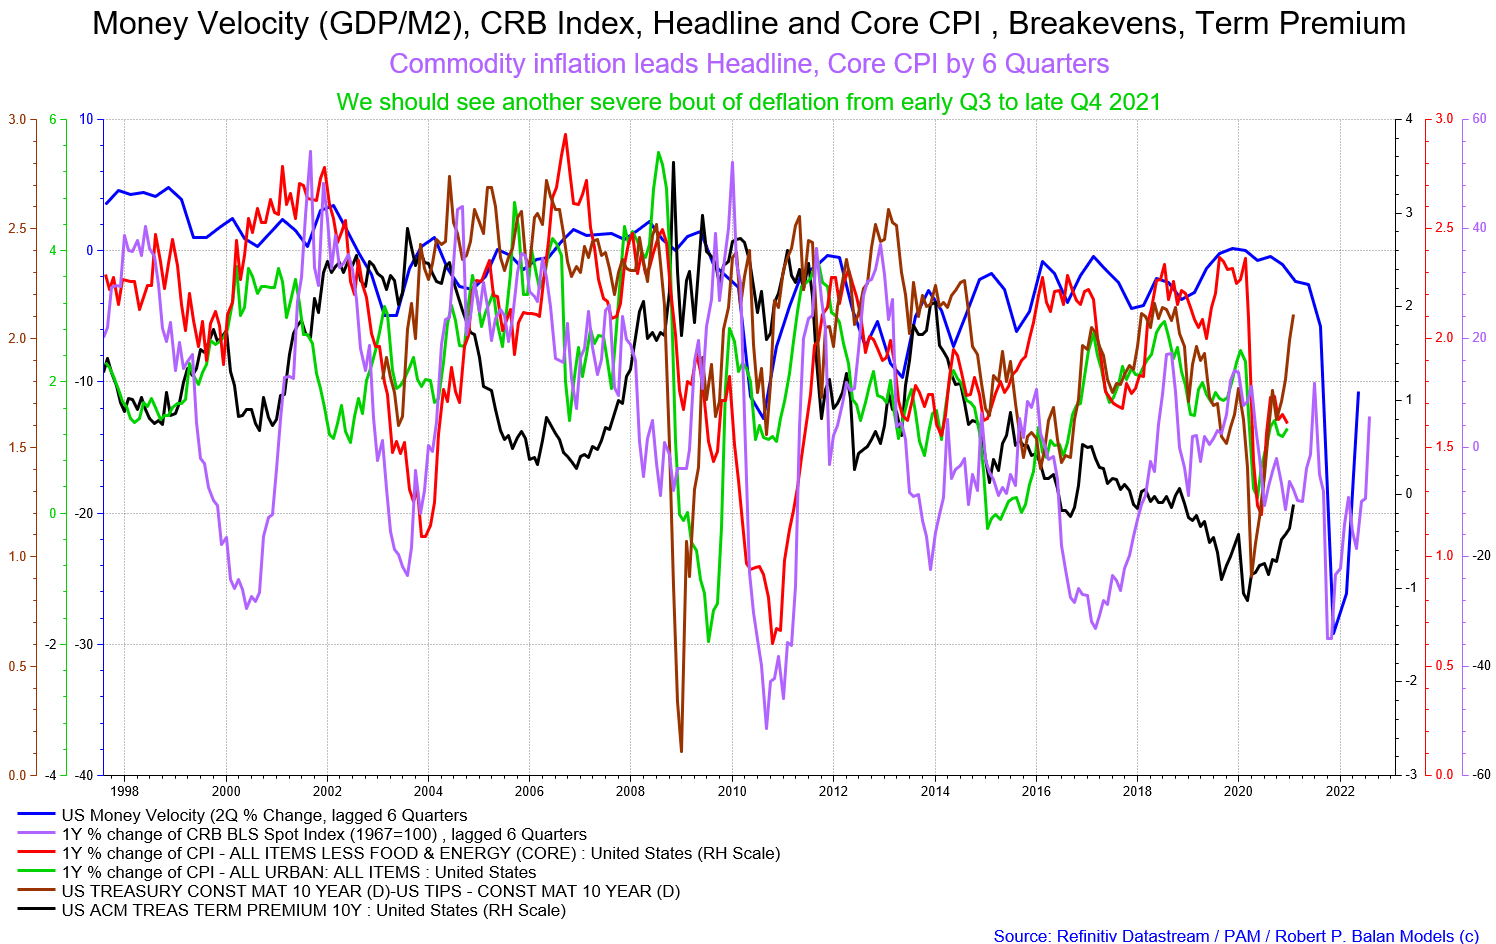
h.jabs -- Commodity inflation is the best forecaster -- ISM surveys only look at the next 6 months. Commodity inflation, as well as changes in Money Velocity, lead ACTUAL CPI inflation (Headline, Core) by 6 quarters.
 robert.p.balanModeratorLeaderOwnerFeb 4, 2021 11:55 AM
We should see another severe bout of deflation from early Q3 to late Q4 2021.
That means the bond term premium and breakevens will fall as in a waterfall (bringing bond yields lower, and yield spreads flatter).
RM13Feb 4, 2021 2:24 PM
That's in line with another economic data gathering fin tech, significant fall off in pricing pressures and postitive economic data at the start of Q3.
robert.p.balanModeratorLeaderOwnerFeb 4, 2021 2:04 PM
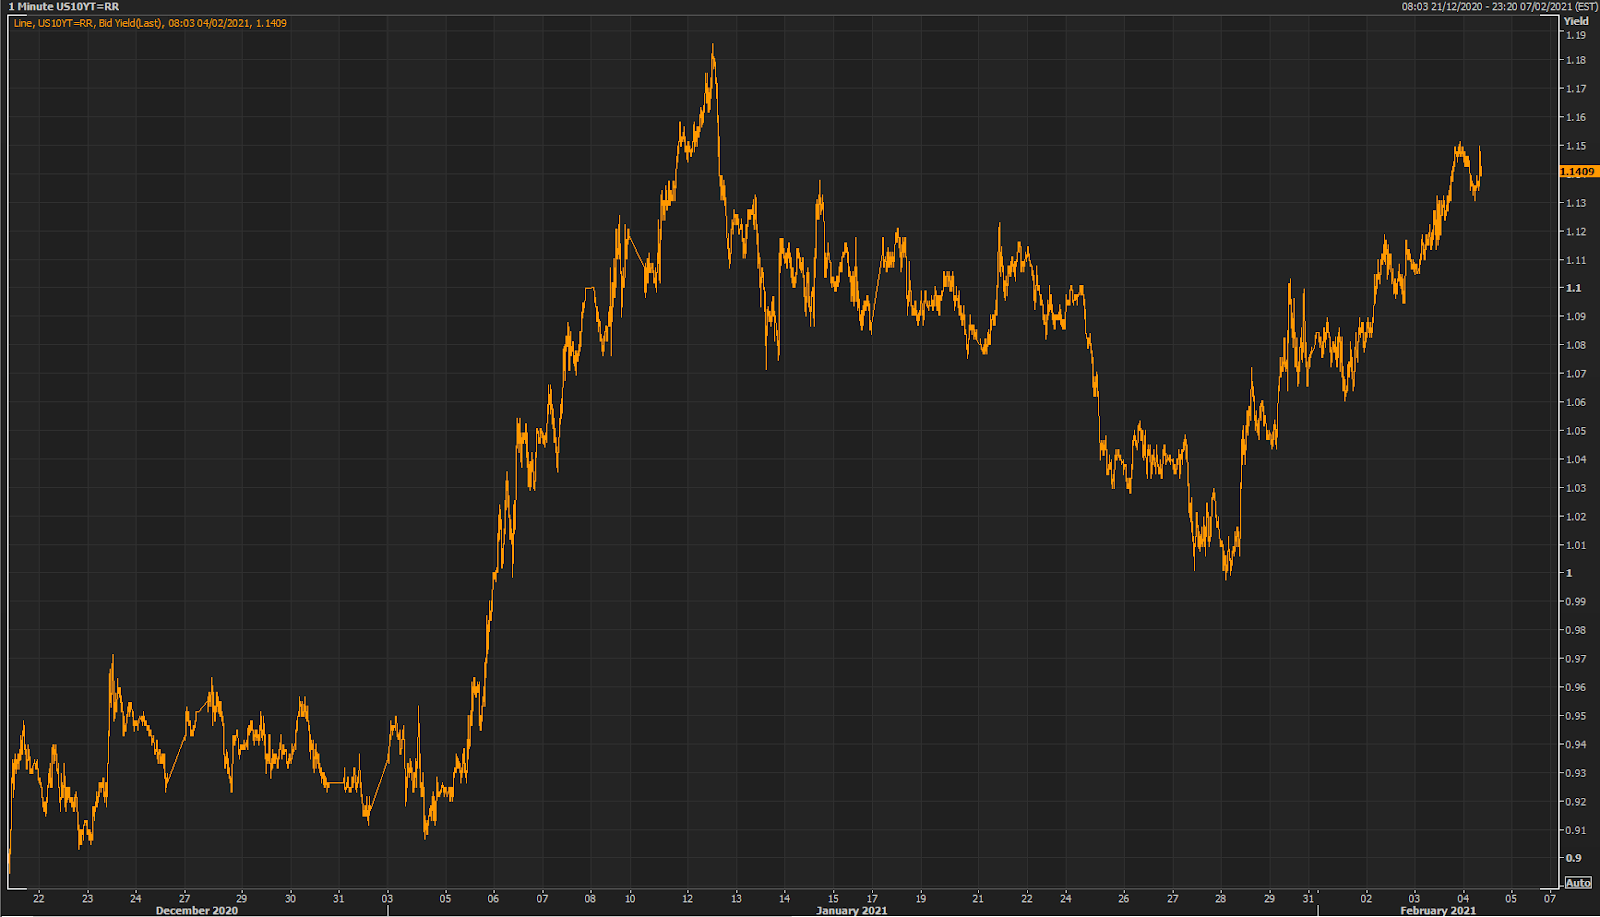 *Yields starting to move higher -- equities are rising in response. Lets put in some small scalpers in RTY and in ES.*
all PAM BUYS 144 CONTRACTS EACH IN RTYH1 AND ESH1, XXX DISCRETION -- ALL FUNDS
*RTYH1 -- DONE AT 2155.25 --- BOUGHT 144 CONTRACTS OF RTYH1 SCALPERS FOR ALL FUNDS*
*ESH1 -- DONE AT 3830 --- BOUGHT 144 CONTRACTS OF ESH1 SCALPERS -- FOR ALL FUNDS*
TO BE UPDATED AFTER NY CLOSE TODAY, THURSDAY, FEBRUARY 4, 2021)

Comments
Log in or sign up to join the conversation.