
Bitcoin (BTC/USD) has managed to break above the psychologically round level of $50k. Can the cryptocurrency challenge the previous high again?

Image Source: Unsplash
Let’s review the long-term charts to analyze the remainder of the year 2021. Will the 2021 bull run outpace the 2017 bull run?
Price Charts and Technical Analysis
(Click on image to enlarge)
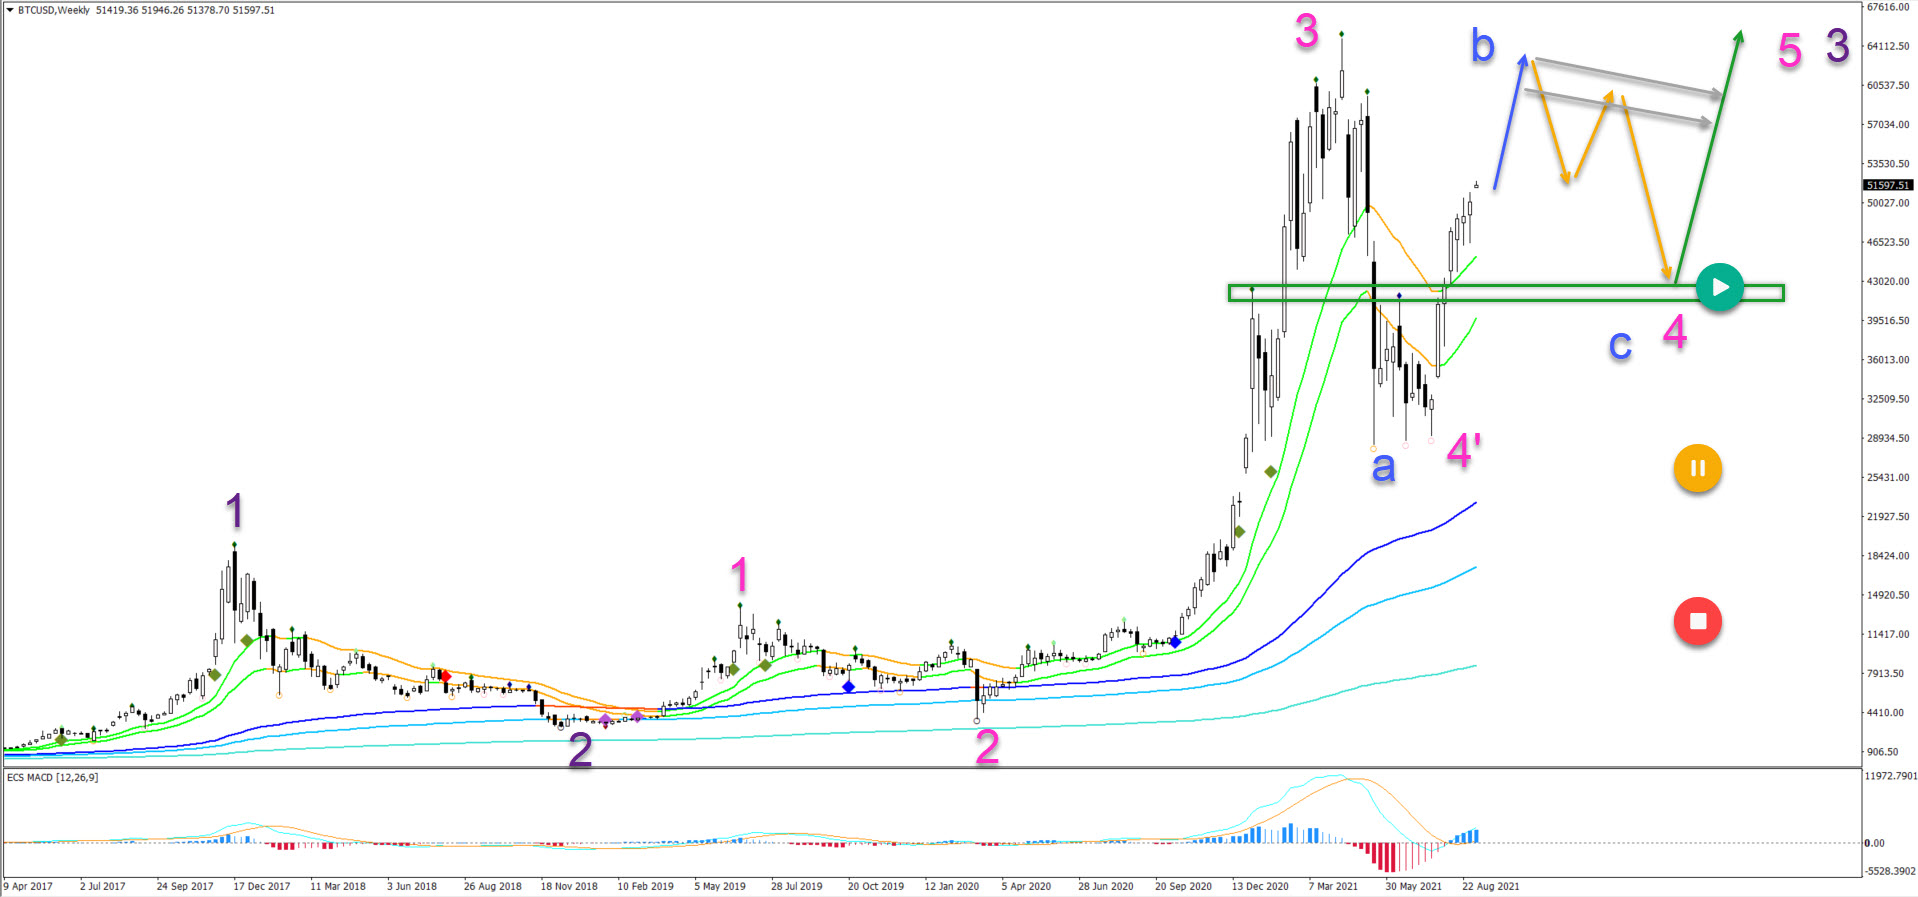
The BTC/USD is showing a strong bullish recovery after a deep bearish pullback:
- Price action has managed to break above the 21 ema zone again.
- The bullish momentum is expected to challenge the previous top (blue arrow).
- The previous top is a strong resistance zone and could stop the uptrend.
- A bearish retracement (orange arrows) could complete an ABC (blue) in wave 4 (pink).
- A bullish bounce (green arrow) could take place at the support zone (green box).
- A bull flag pattern (grey arrows) however indicates that the immediate uptrend remains valid. In that case, a wave 4’ finished at the recent low.
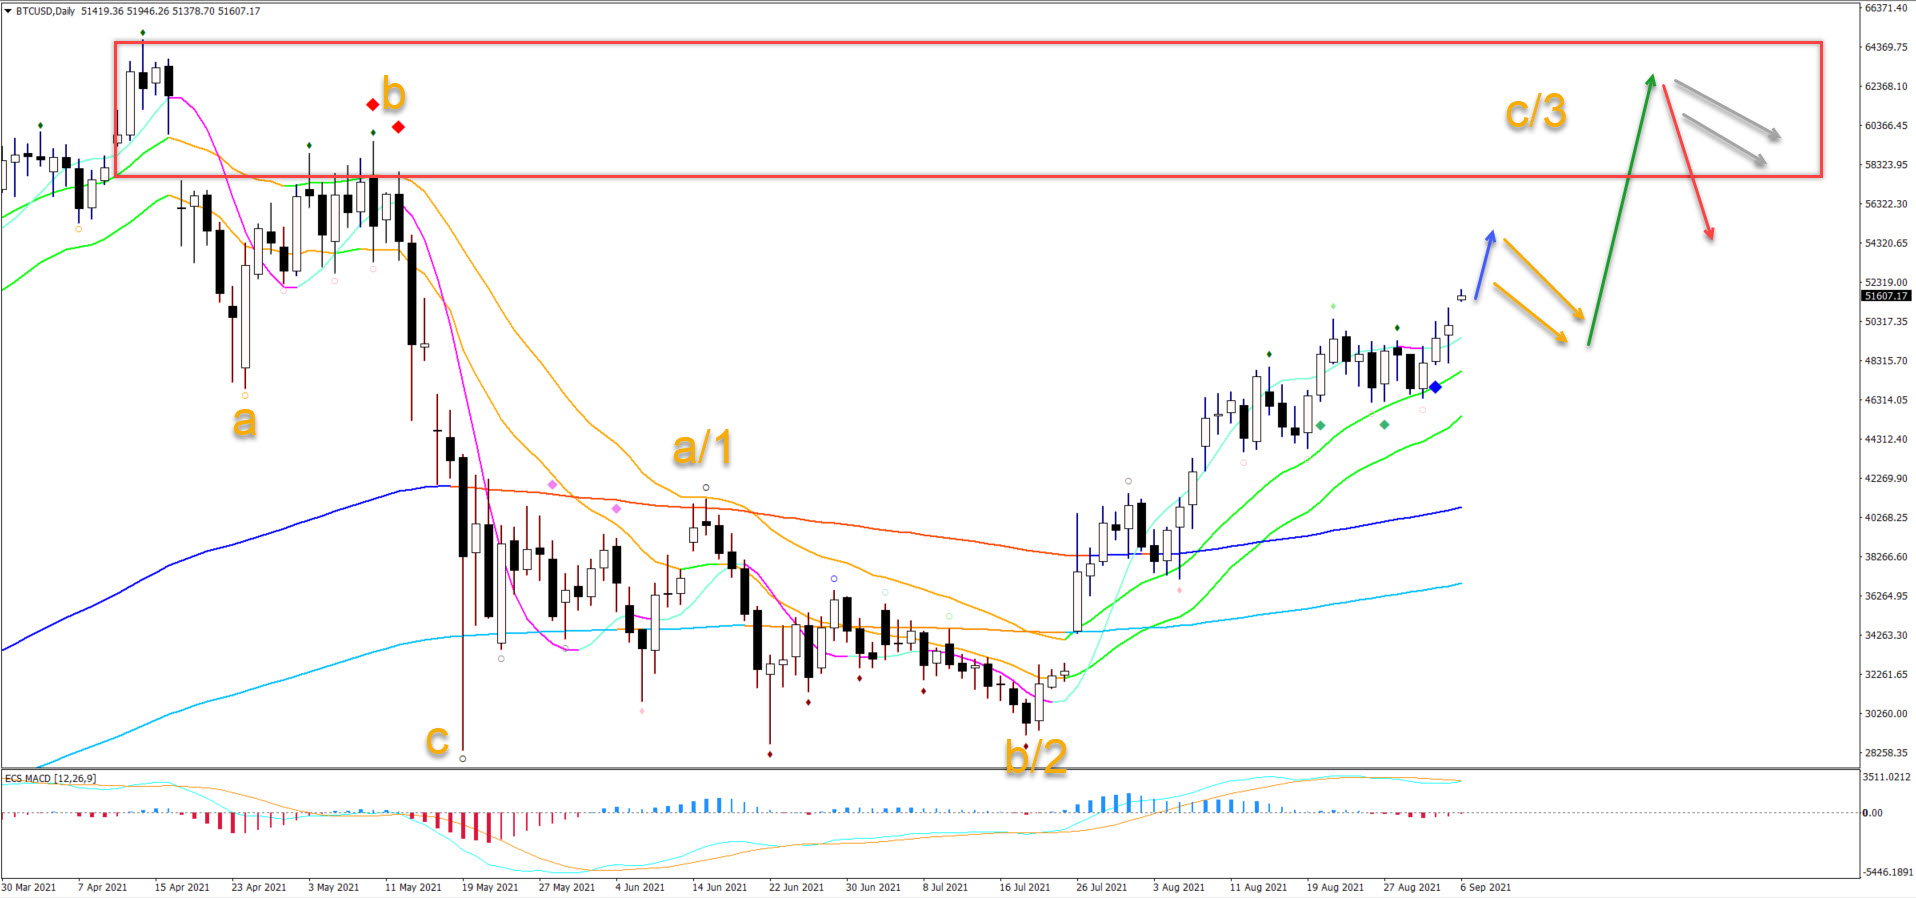
On the daily chart, we see that the bullish momentum is strong because price action remains above the 21 ema zone for a long time:
- The bullish price swing is either a wave C or 3 (orange).
- This depends on the price reaction at the resistance zone (red box).
- A bearish reversal (red arrow) indicates a wave C and more bearish correction.
- A flag pattern (grey arrows) indicates a wave 3 continuation.
(Click on image to enlarge)


Comments
Log in or sign up to join the conversation.