


The midterm elections have come and gone. Democrats took a clean sweep.
Stocks staged a nice bounce the day after the vote. That bounce turned out to be a false move ahead of a major flush lower.
Tech and semiconductors took the worst of it. Traders spent the week staring at red screens and bracing for the next leg down.
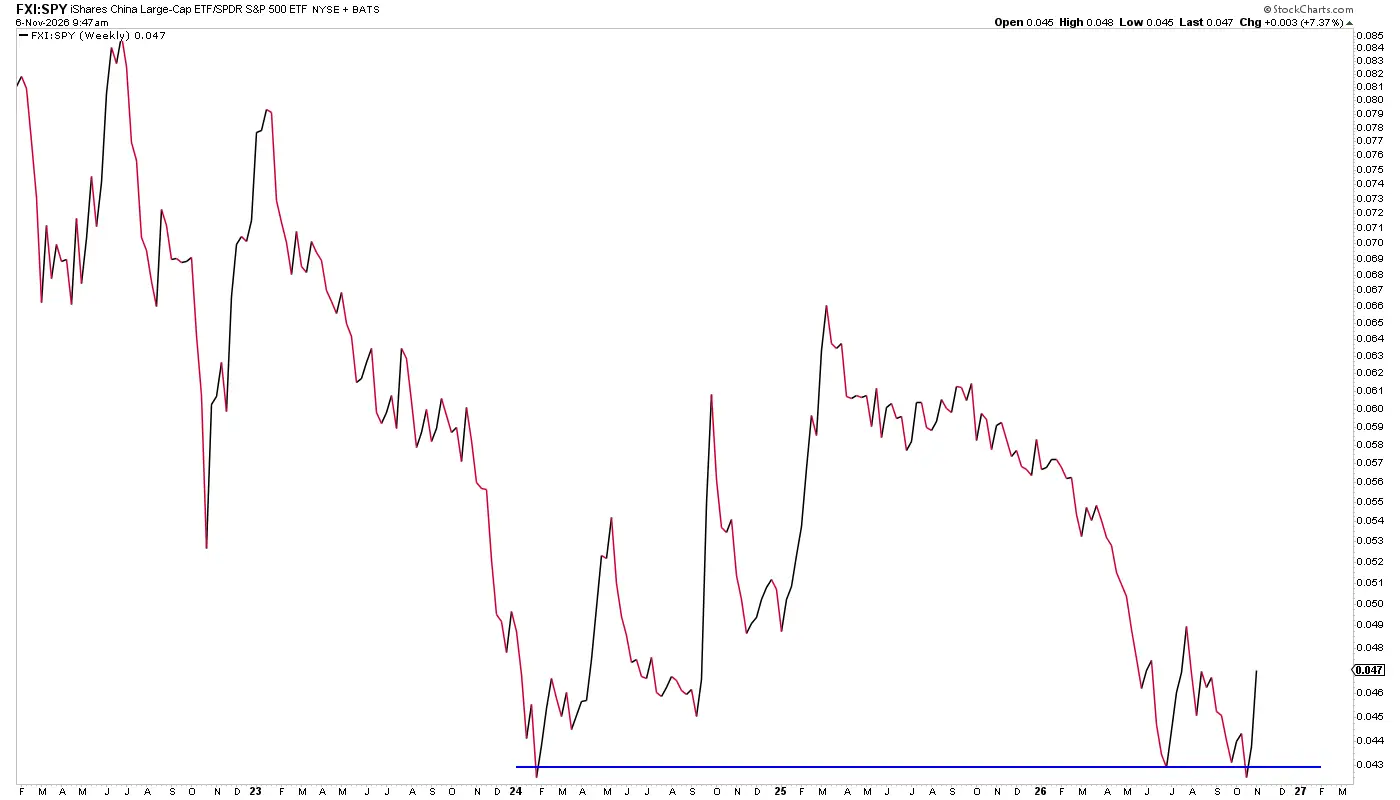
While everyone was freaking out about the rout, the FXI SPY ratio flagged a monumental shift on the other side of the Pacific. Chinese stocks moved sharply higher while U.S. tech got hammered.
I flagged this same setup a few months back. I was a bit early.
The chart is giving it a second chance now, and this time the signal looks cleaner. If your attention has been locked on U.S. tech, you could be missing the best opportunity of the next year.
It all comes down to the FXI SPY ratio and one classic market pattern. By the end, you’ll know the exact level I’m watching and what it would take to prove this setup wrong.
Let’s start with the numbers that caught my eye.
A Performance Spread You Can’t Ignore
Last week, the Nasdaq 100 dropped over 4%. Large-cap Chinese stocks gained nearly 5% over the same stretch.
That puts the gap at around 9 percentage points in a single week. A spread that wide tells you the market is treating these two regions very differently right now.
I track this relationship with the FXI SPY ratio. FXI is the iShares China Large-Cap ETF. SPY tracks the S&P 500.
The FXI SPY ratio divides one price by the other. A rising line means Chinese large caps are beating U.S. stocks. A falling line means the U.S. is winning.
Why This FXI SPY Ratio Level Matters
The FXI SPY ratio just bounced off a key level that has been important for years. Its history around this line tells the story:
In 2024, a bounce from this level led to a notable period of outperformance by Chinese stocks over U.S. stocks.
This past summer, the FXI SPY ratio attempted another bounce. I brought it up at the time, and the attempt failed.
Recently, the ratio slipped below support. Then it snapped right back above it.
That last move is the one I care about. It looks like a false breakdown.
A false breakdown happens when price drops below an obvious support level and quickly reverses. Sellers who pressed the break get trapped on the wrong side.
Their scramble to exit adds fuel to the reversal. That’s why these patterns can move so quickly once they get going.
There’s an old saying I lean on here. From false moves come fast moves.
The FXI SPY ratio just printed a false move. If the saying holds, the next leg in Chinese stocks could arrive faster than people expect.
How I’m Reading the FXI SPY Ratio
I don’t think the U.S. is heading into a full-fledged bear market right now. Drawdowns are a normal part of every bull market, and I don’t panic over them.
Whether this shift started before the midterm results is a philosophical trading question. We don’t need to settle it today.
FXI tells me Chinese large caps as a group are turning. Within that group, Chinese tech is the corner I’m watching most closely for the next 12 months.
This may be the spot to find alpha. Alpha simply means returns above what the broader market delivers.
Pull up the FXI SPY ratio this week and mark that support level. The false breakdown stays intact as long as the ratio holds above it.
A move in the FXI SPY ratio back below support would tell you the signal failed. Until then, I’m treating China as one of the most interesting setups on my screen.



Comments
Log in or sign up to join the conversation.