
To be sure, Friday's jobs report created some uncertainty in terms of traders' Fed-expectations. While I can argue that the expectations regarding the degree and speed of anticipated rate cuts had gotten a little out of hand, the question of the day now becomes, what should we expect? As in what should we expect from Chairman Powell's dueling Congressional testimonies this week? What should we expect from the July Fed meeting? What should we expect from the upcoming earnings season, the economy, and inflation? And, of course, what should we expect from the stock and bond markets in the coming months?
If I have learned anything in my 32 years of professional investing, it is that trying to figure out what is going to happen next in Ms. Market's game with any degree of accuracy and/or consistency is a fool's errand. However, I have also learned that being prepared for what might/could happen next within a given time frame makes pulling the trigger on portfolio moves easier. In other words, if I have some idea of what is likely to happen, it is less emotionally taxing to make the necessary adjustments in a timely fashion.
It is for this reason that I make a habit of reviewing the stock market's historical cyclical patterns on a weekly basis. As the saying goes, history doesn't repeat itself, but it often rhymes. And I've found that oftentimes the stock market's seasonal tendencies will persist for some time.
Stock Market Cycles
Long-time readers know that I utilize a "cycle composite" in my work, which is the brainchild of the folks at Ned Davis Research Group. The analysts at NDR take all the one-year seasonal, four-year Presidential, and 10-year decennial cycles since 1900 and mash them up into a single composite. The cycle composite's projection for the year is then plotted on a chart to provide a graphical representation of what the historical cycles look like for the S&P 500 and the DJIA.
What I've found is that while no indicator can ever be expected to be perfect, when the S&P 500 is in sync with its historical cycles, the composite projection of what might happen next in the stock market can be good - as in, scary good.
Of course, there are times when Ms. Market zigs when she was projected to zag. Obviously, this is to be expected from time to time. And of course, there is no such thing as a crystal ball in this game. However, the cycle composite can be very helpful in terms of plotting out what might happen in the coming months.
For example, if I have some cash in a portfolio that needs to be put to work, knowing what the market has historically done in the coming months can make the decision of when to put the money to work easier. Again, nothing in this business is foolproof. But the cycle composite provides me with a sense of what the odds suggest could happen next. And it is for this reason, that I review the projections of the cycle composite on a weekly basis.
What the Cycles Say About the Rest of the Year
So, without further ado, let's take a peek at this year's cycle composite. In the chart below the blue line is the cycle composite's projection while the red dashed line is the action price action of the S&P 500...

View Full-Size Chart Online
Source: Ned Davis Research Group
The first thing to note about the current chart is that the S&P (red line) is currently almost exactly where the cycle composite projected it would be at this point in the year. Sure, the path of the index has diverged along the way. This is likely due to the Fed's quick pivot early in the year, which caused an equally violent "correction of the correction," erasing last December's dance to the downside in its entirety. However, May's correction and then June's rebound has managed to put the S&P back in sync with the cycle projection. Interesting.
So, what should we expect next? According to the cycle composite, the summer rally should continue into early September. And if Powell & Co. deliver the anticipated rate cut in this timespan, it is easy to see why the current joyride to the upside could continue.
From there, we may get a "fall swoon" lasting into late October, which would be followed by the traditional year-end rally - taking the index back toward the highs of the year.
My Takeaway
What this tells me is that while stocks are overbought currently, the bulls might still have some gas left in the tank. So, we shouldn't be too surprised if stocks continue to rally this month and next. However, the cycle composite also suggests that there may be a pretty good buying opportunity during the next pullback.
Of course, if Jay Powell decides to walk back expectations for a July rate-cut this week on Capitol Hill, the cycle projection could become useless in the near-term. Such is the case with news-driven environments.
But if Ms. Market continues to stick to the script, I for one will be looking to buy the next dip in anticipation of a strong run into the end of the year and the seasonally strong start to new calendar years. Fingers crossed!
Weekly Market Model Review
Now let's turn to the weekly review of my favorite indicators and market models...
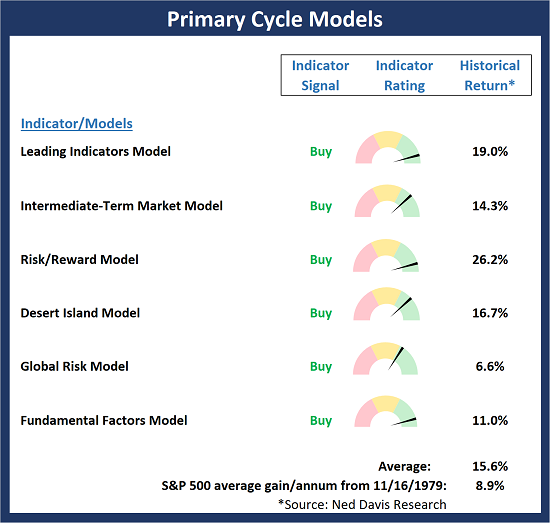
The State of My Favorite Big-Picture Market Models
The Primary Cycle board continues to improve as the readings of the individual models moved higher again last week. So, while an inevitable pullback is to be expected in the coming days/weeks, this board tells us to look at any weakness as an opportunity to add exposure.
This week's mean percentage score of my 6 favorite models improved to 81.1% from 73.5% last week (Prior readings: 62.9%, 65.4%, 62.9%, 60%, 60%, 72.5%) while the median also rose to 82.5% versus 68.5% last week (Prior readings: 66.3%, 71.3%, 68.8%, 62.5%, 62.5%, 80.0% 82.5%).
The State of the Fundamental Backdrop
The fact that the component indicators within the Fundamental board continues to improve, tells me to give the bulls the benefit of any doubt and to buy the inevitable dips. I will continue to monitor the monetary, earnings and valuation models closely for any signs of deterioration. But so far, so good.

View Fundamental Indicator Board Online
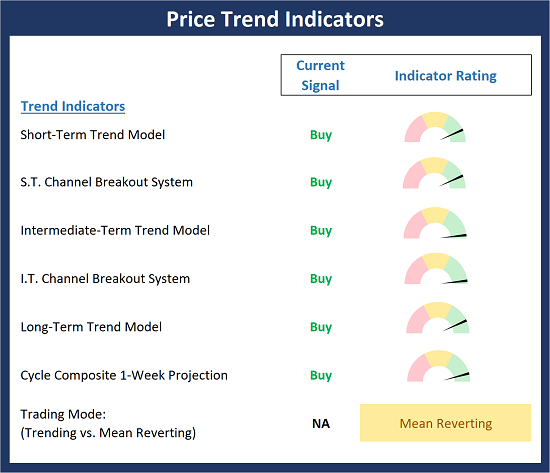
The State of the Trend
Yes, this remains a news-driven environment, especially from a short-term perspective. And yes, Jay Powell could certainly provide a reason for some profit-taking if he even hints at walking back rate cuts this week. But from a purely technical perspective, investors need to recognize that the trend is their friend and the trend indicators are about as positive as they can be at the current time. So, again, "buy the dips" would appear to be an appropriate battle cry here.
View Trend Indicator Board Online
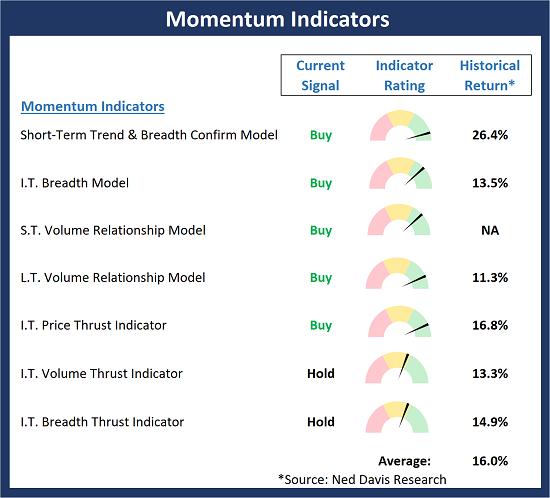
The State of Internal Momentum
The Momentum board remains in very good shape. However, I will admit that the board is not in a "pound the table" mode at the present time. This tells me that while it is fine to be invested, it may not be the time to "put the hammer down" in terms of how aggressive portfolios should be positioned at the present time.
View Momentum Indicator Board Online
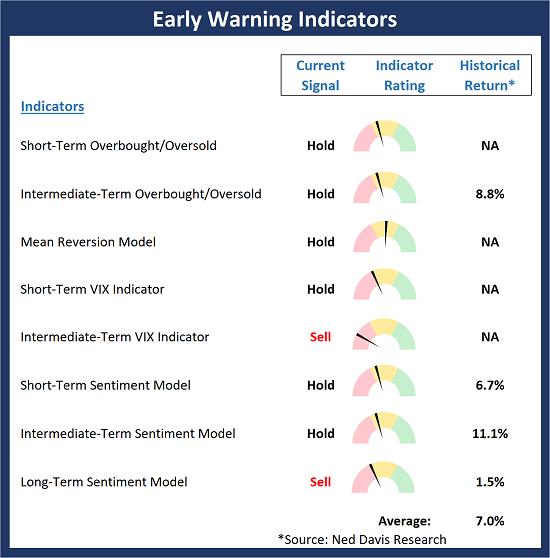
The State of the "Trade"
While the changes to the Early Warning board are nuanced and somewhat hard to see, it looks to me that the board is moving toward a bearish setup from a short-term trading perspective. Although the table is not yet set nicely for our furry friends in the bear camp, I believe it is important to be ready/looking for the next pullback.


Comments
Log in or sign up to join the conversation.