

The abstract from the recent IMF’s World Economic Outlook chapter on investment:
Private fixed investment in advanced economies contracted sharply during the global financial crisis, and there has been little recovery since. … business investment accounts for the bulk of the slump, and the overriding factor holding it back has been the overall weakness of economic activity. In some countries, other contributing factors include financial constraints and policy uncertainty. These findings suggest that addressing the general weakness in economic activity is crucial for restoring growth in private investment.
I think this summary is interesting to the extent it relegates the policy uncertainty factor to second tier, placing at the forefront deficient aggregate demand. This conclusion was hinted at in this 2012 post. Here’s an update on US business fixed investment.
First, let’s examine net investment, as opposed to gross investment, is the variable of interest in theoretical models.
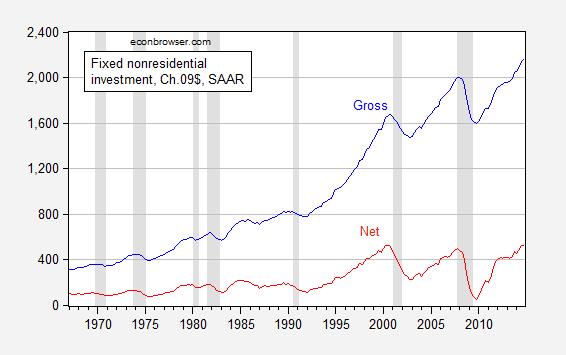
Figure 1: Nonresidential gross (blue) and net (red) fixed investment, in billions Ch.2009$, SAAR. NBER defined recession datse shaded gray. Source: BEA (2014Q4 2nd release), NBER, and author’s calculations.
Figure 1 makes clear that net investment in constant dollars is pretty much constant from peak to peak.
Now, what of the policy uncertainty? Since the last shutdown, uncertainty, as measured by the Baker, Bloom and Davis index has declined substantially. Investment has increased, but a much bigger increase occurred before the decline.
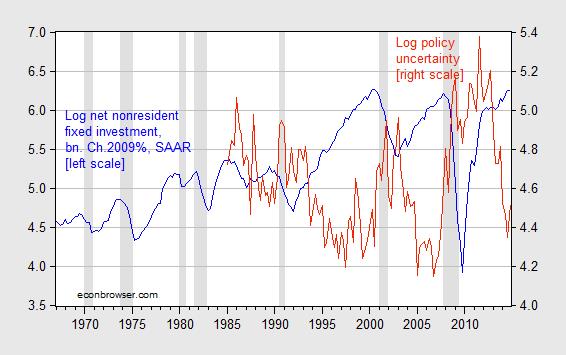
Figure 2: Log net nonresidential fixed investment (blue) and log policy uncertainty (red). NBER defined recession datse shaded gray. Source: BEA (2014Q4 2nd release), author’s calculations, NBER, and policyuncertainty.com.
Most models focus on the investment to capital ratio. I plot the gross and net investment to capital log-ratios in Figure 3 (for an explanation of why one needs to log, see this post).
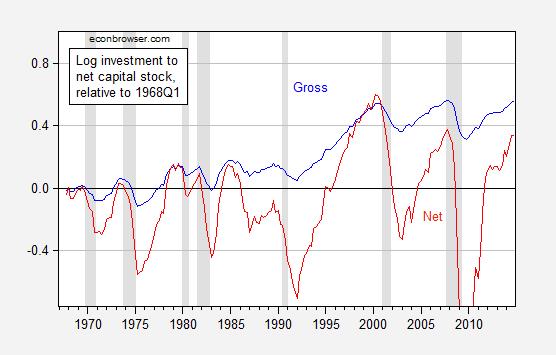
Figure 3: Gross nonresidential fixed investment (blue) and log net nonresidential fixed investment (red) as a log ratio to net nonresidential capital stock. NBER defined recession datse shaded gray. Source: BEA (2014Q4 2nd release), NBER, and author’s calculations.
What’s the impact of policy uncertainty? In order to obtain a first-cut answer, I run a regression of log investment to capital stock over the 1985Q1-2014Q4 period on the four quarter growth rate of real GDP, on log policy uncertainty, and the real S&P (a proxy for Tobin’s q), along with a linear time trend.
log(I/K) = -9.2 + 7.85Δy – 0.029U + 0.87log(S&P) -0.007time
Adj-R2 = 0.50, SER = 0.31, DW = 0.22 N = 120. Bold face denotes significance at the 5% MSL, using HAC robust standard errors.
While the DW statistic is pretty low, if one first differences this specification and omit the time trend, then the only statistically significant variable is GDP variable…



Comments
Log in or sign up to join the conversation.