

With the official GDP update on the current state of the US economy not due for months, we take a look at the latest real-time indicators compiled by some of the largest banks.
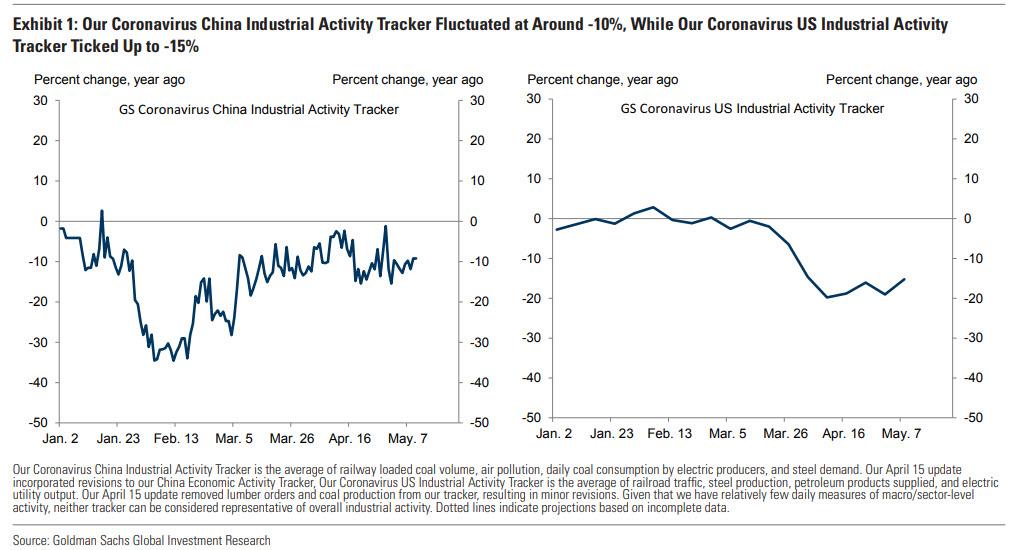
We start with Goldman's global activity tracker, which showed some more good news, ticking up to -15% YoY for the week of May 3-9, while US Industrial Activity ticked up to -15%.
(Click on image to enlarge)
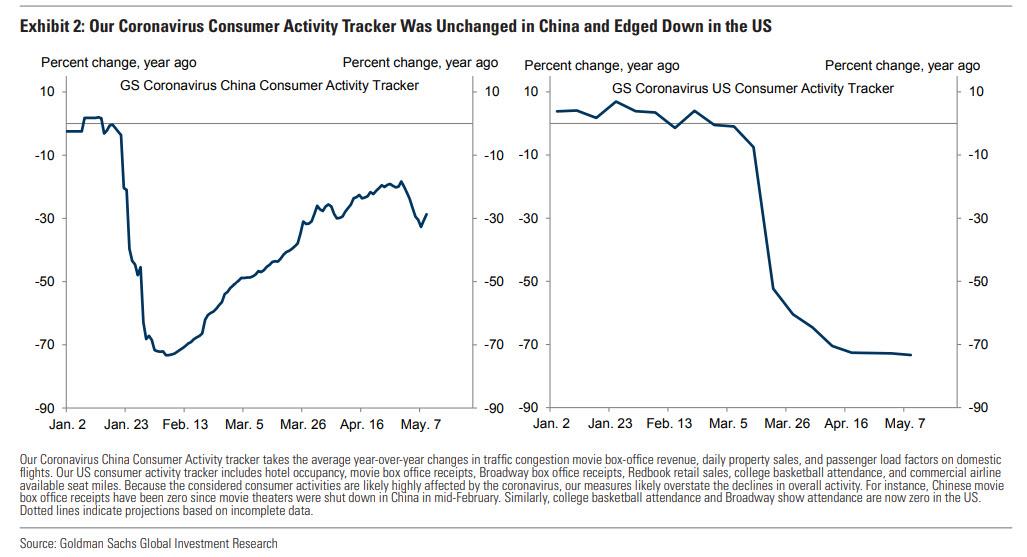
Away from the manufacturing economy, the picture in the US remains dismal: Goldman's US Consumer Activity Tracker—which tracks spending in categories of consumption that are likely to be disproportionately affected by the virus—edged down to -73% yoy, as China also appears to be suffering a setback in recent days.
(Click on image to enlarge)
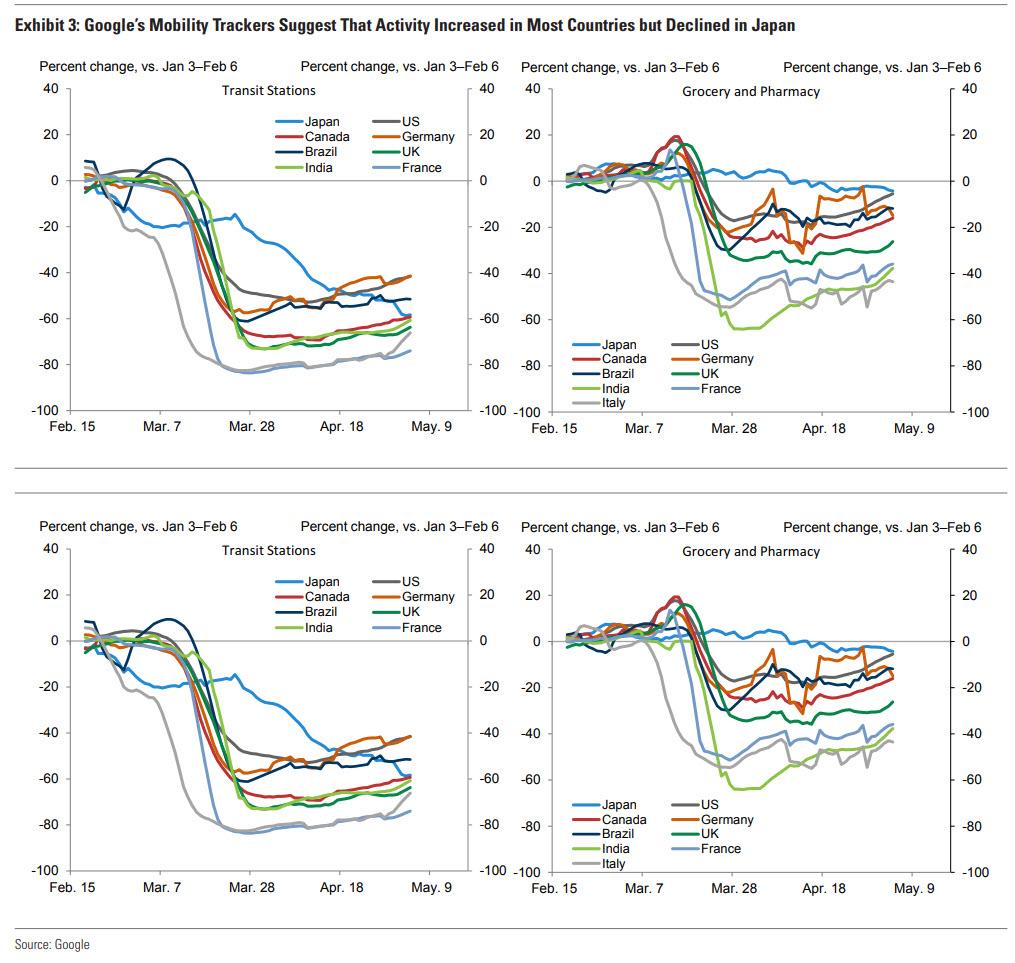
Google’s mobility trackers suggest that activity increased in most countries, but declined in Japan.
(Click on image to enlarge)
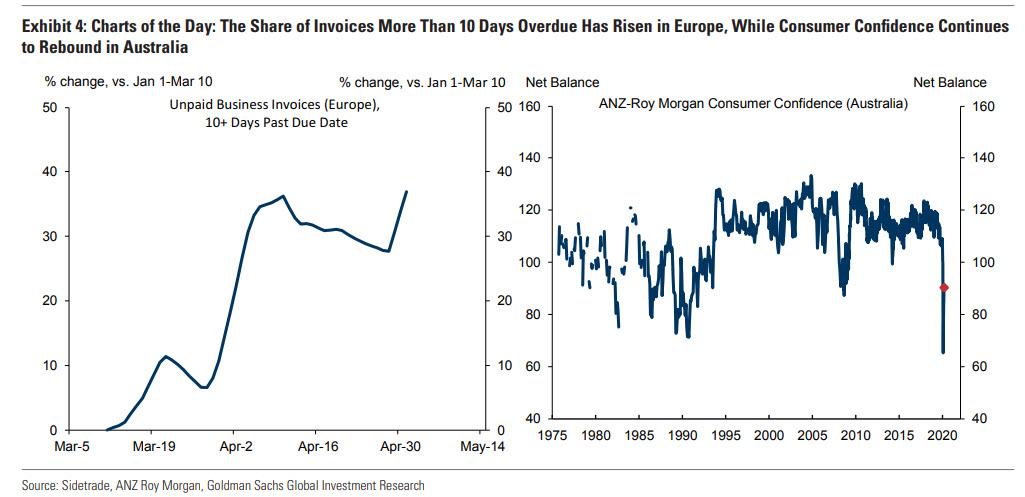
One especially ominous chart comes from Europe, where the percentage of invoices unpaid for more than 10 days has risen to an all-time high of 37% relative to its pre-virus level in Europe; on the flip side, consumer confidence continues to rebound in Australia.
(Click on image to enlarge)
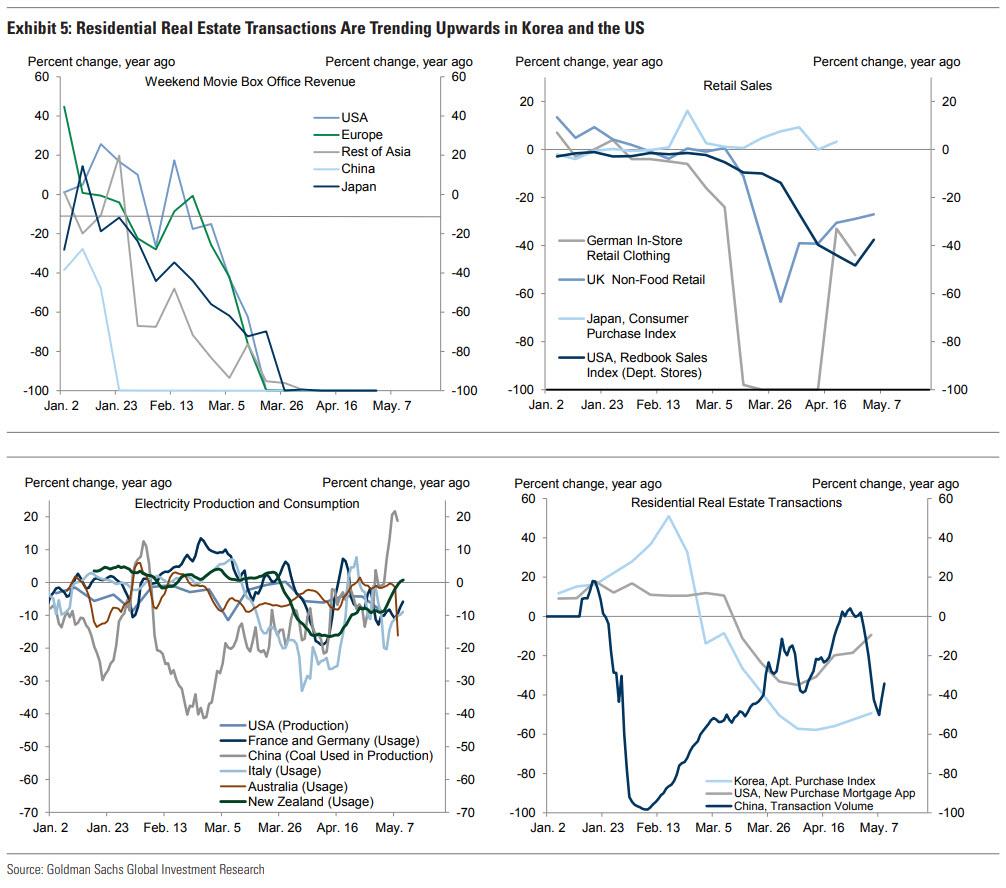
Cinemas remain dead around the globe, retail sales have managed a modest recovery in Germany if not in the US, while there was more good news in the real estate sector where transactions are trending upward in Korea and the US.
(Click on image to enlarge)
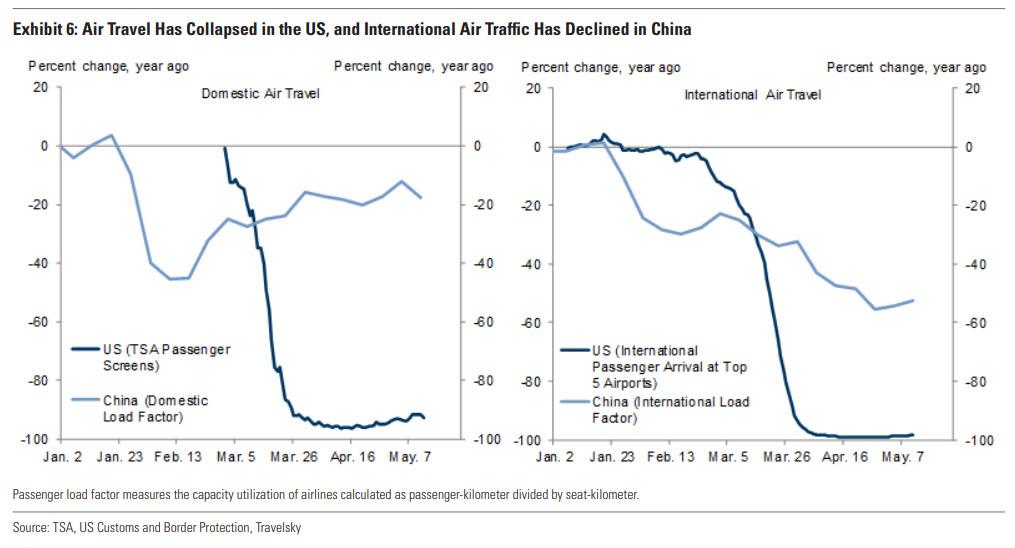
There is no recovery in US air travel, however, and while domestic load factors in China have rebounded, international travel continues to decline.
(Click on image to enlarge)
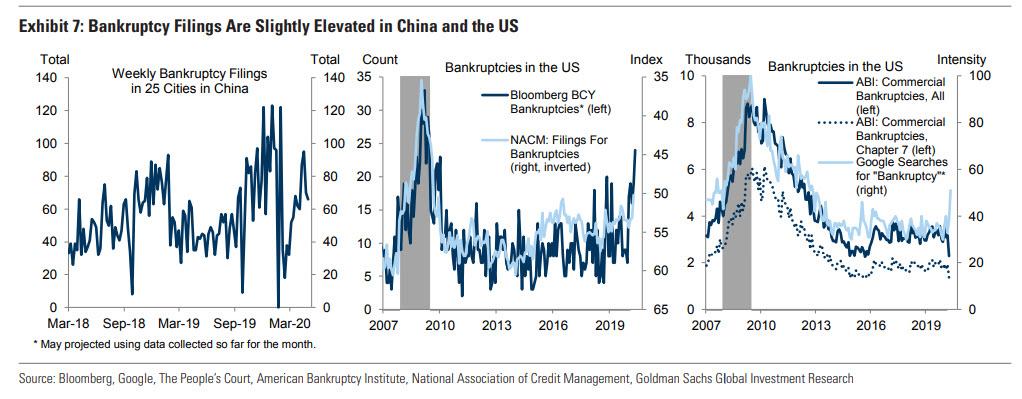
Another silver lining is that while bankruptcy filings are slightly elevated in China and the US, the full avalanche has yet to start even though google searches for "bankruptcy" are on the rise.
(Click on image to enlarge)
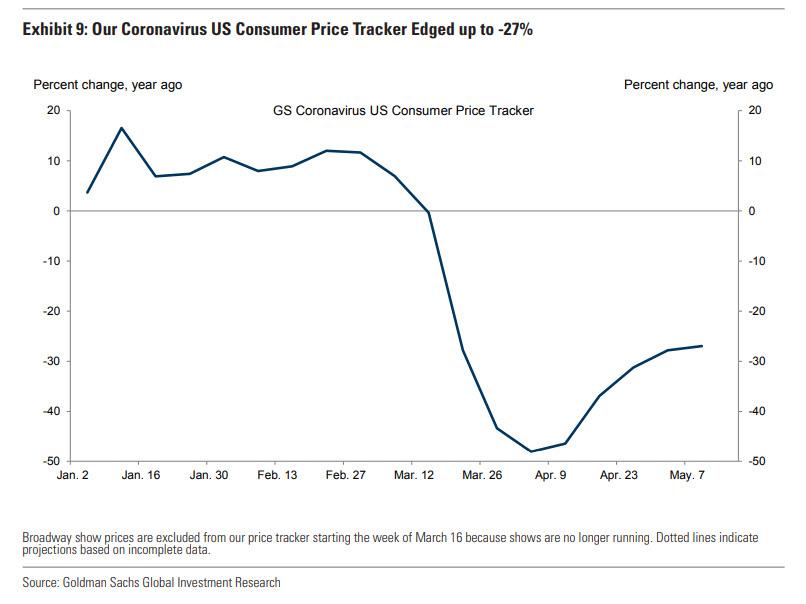
One place where there are clear signs of a recovery in the US, is consumer prices which after troughing in early April have managed to cut losses in half.
(Click on image to enlarge)
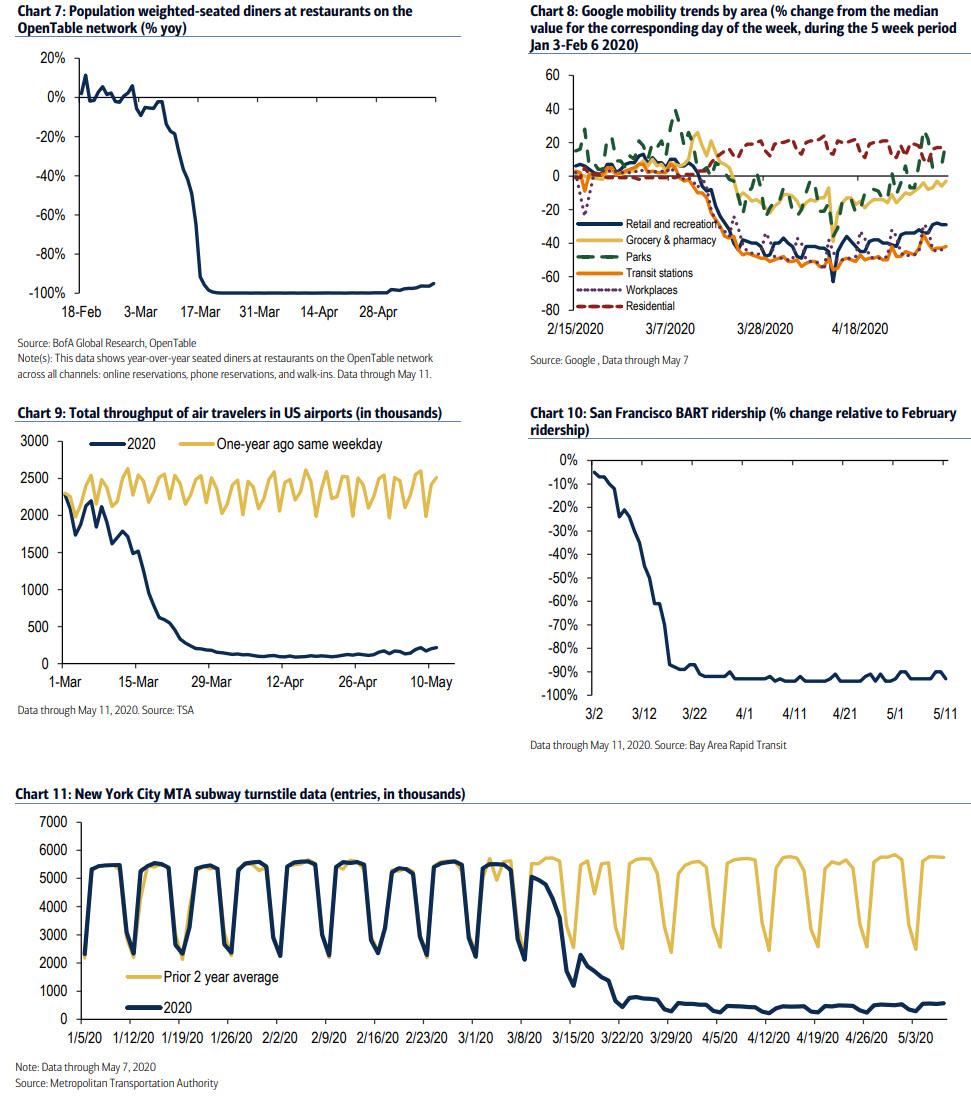
Next, we look at Bank of America's indicators, which focus on restaurant dining (tiny rebound from all-time lows), general mobility, subway ridership in San Fran, and New York...
(Click on image to enlarge)
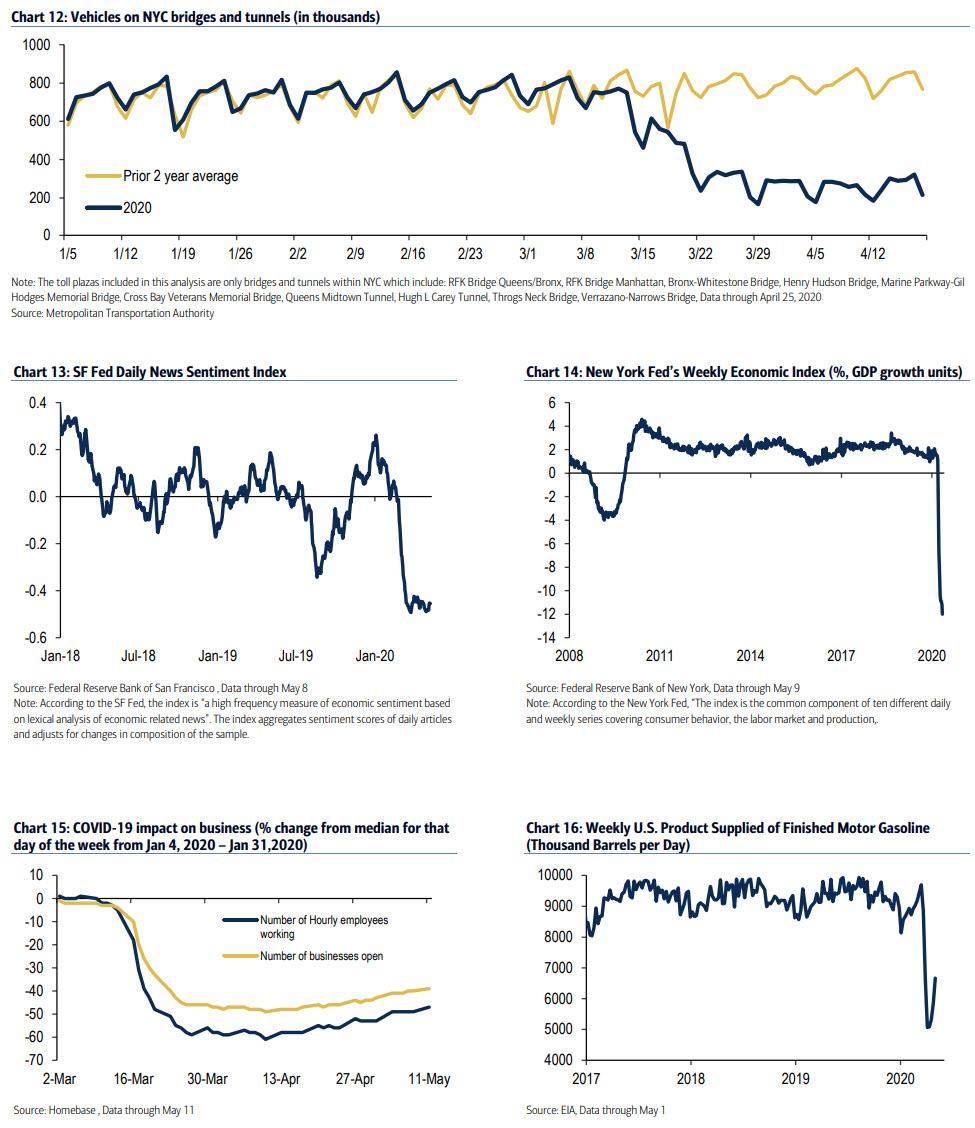
... as well as overall traffic in NYC, news and economic sentiment, business impact, and gasoline usage.
(Click on image to enlarge)
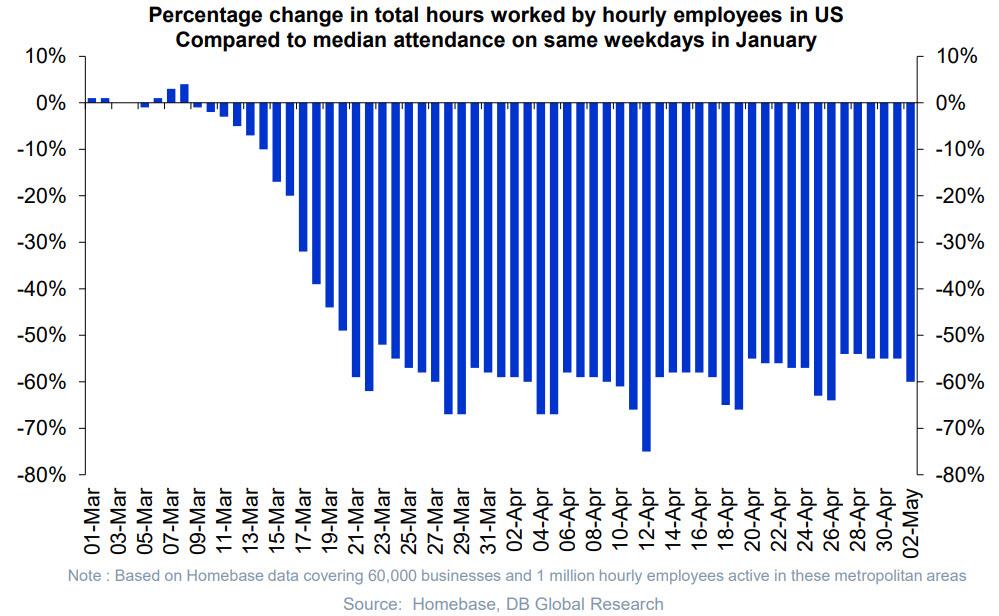
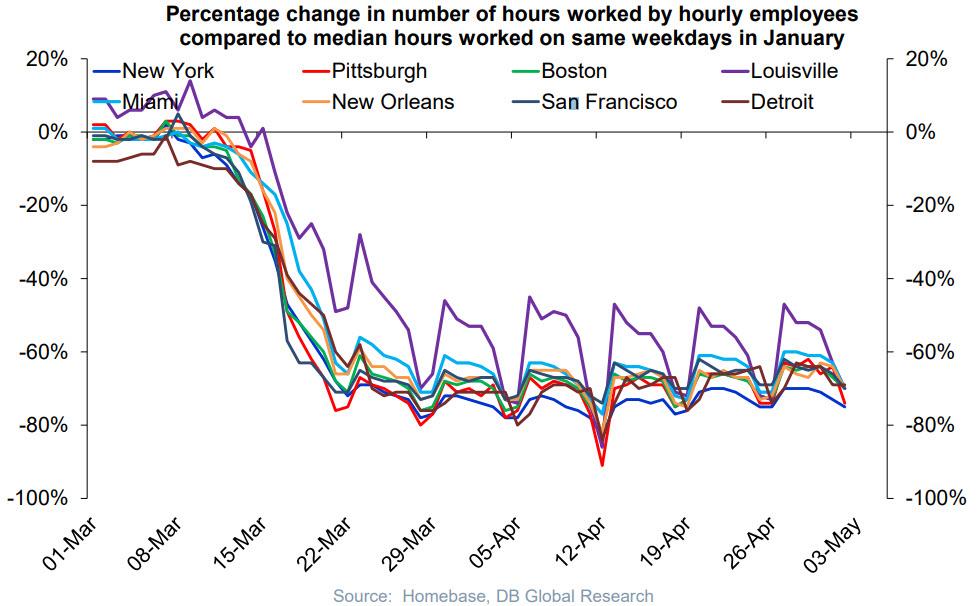
Finally, we shift to Deutsche Bank which finds signs of stabilization among small businesses, specifically in the Percentage change in total hours worked by hourly employees in the US Compared to median attendance on same weekdays in January...
(Click on image to enlarge)
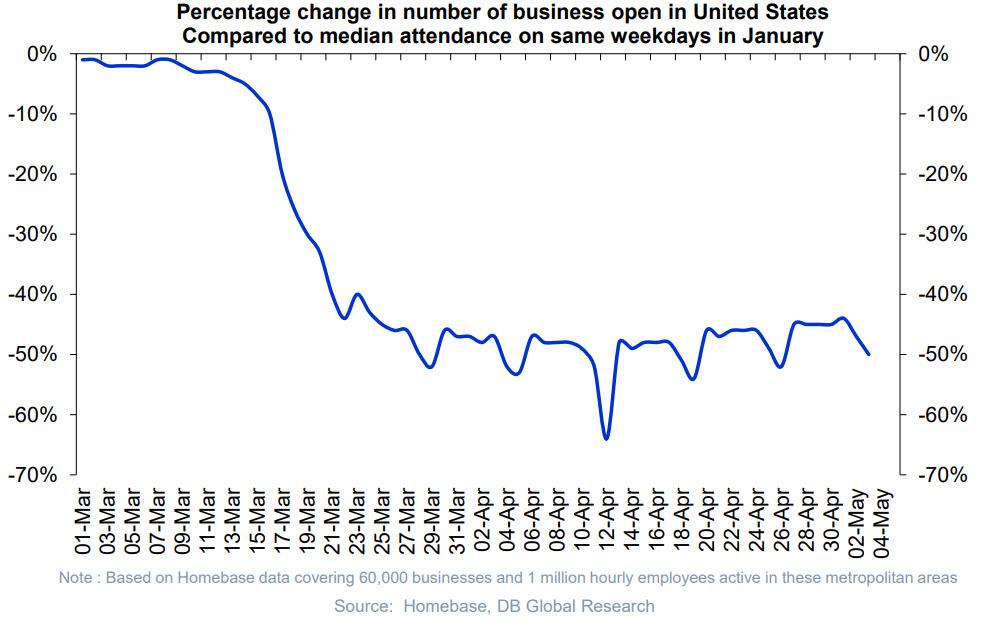
... and the percentage change in number of business open in the United States Compared to median attendance on same weekdays in January.
(Click on image to enlarge)
Of course, stabilization does not mean recovery, as the flatlining in the percentage change in number of hours worked by hourly employees compared to median shows.
(Click on image to enlarge)
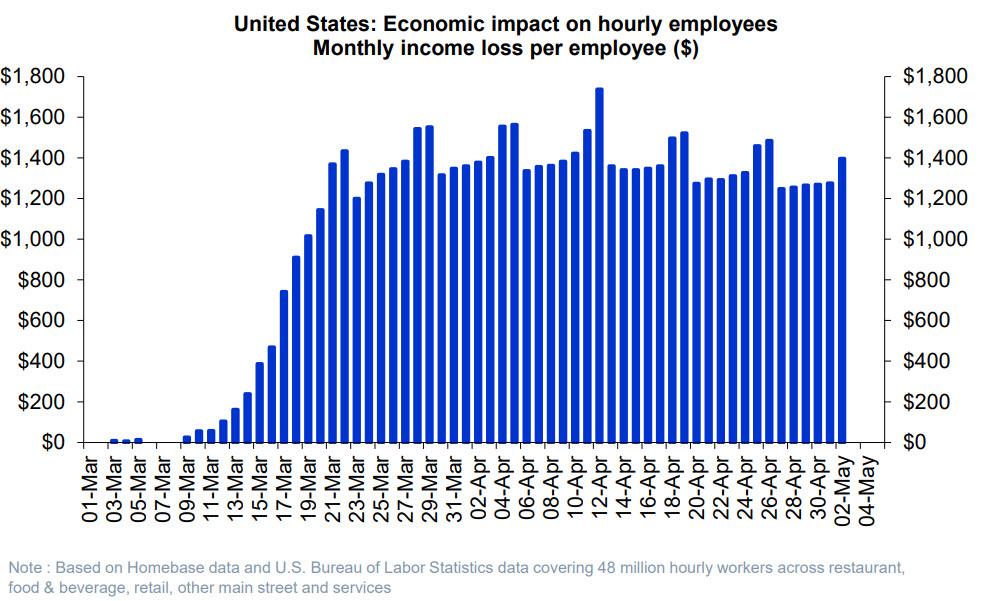
Meanwhile, hourly employees continue to lose over $1,2000 on average as a result of the shutdown.
(Click on image to enlarge)
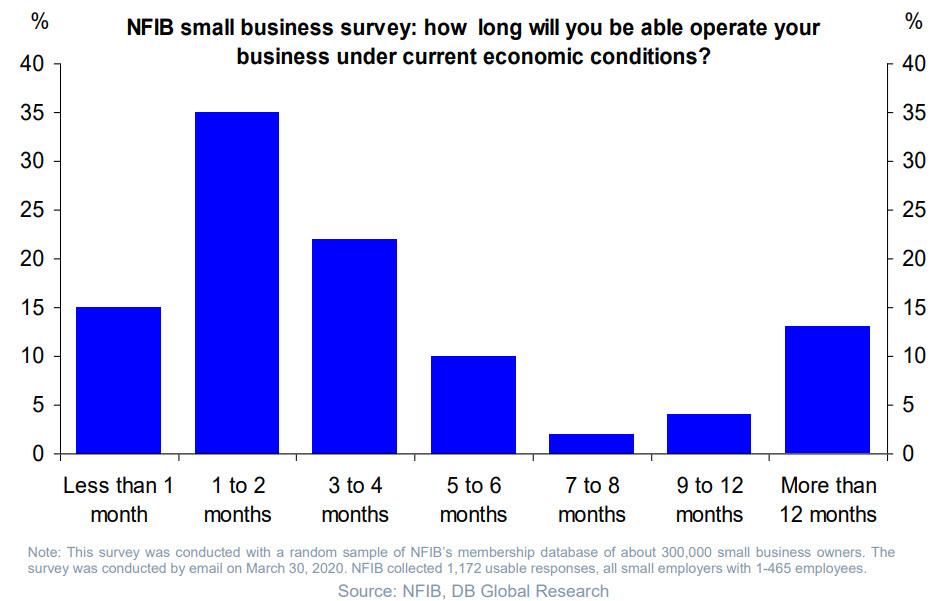
And, as always, we go back to the big question: how much longer will the shutdown continue because as the NFIB has found, most business in the US can only operate for 1-2 months under current economic conditions. It is now almost 2 months since the shutdown, so once the government bailout support starts drying out and is not replenished, we will likely see the next big hit to the US economy.
(Click on image to enlarge)



Comments
Log in or sign up to join the conversation.