


We believe the events of the past two weeks will mark a historic change for investors and for the world.
Russia opened Pandora’s Box when it invaded Ukraine in February. Even the most optimistic resolution scenario will not get us back to the way the world was before. Geopolitically, the subsequent dominoes have brought us to the brink of World War III.
Coming into this crisis, the oil market was already relatively tight. By most estimates, global demand was outstripping supply by approximately 1.5 to 2 million barrels per day (mmbpd).
As a result, oil’s term structure remained backwardated as viewed by our curve indicator throughout this time. With the effective removal of Russian crude from the supply-side of the equation, however, the oil market has gone from tight to a generational crisis.
(Click on image to enlarge)
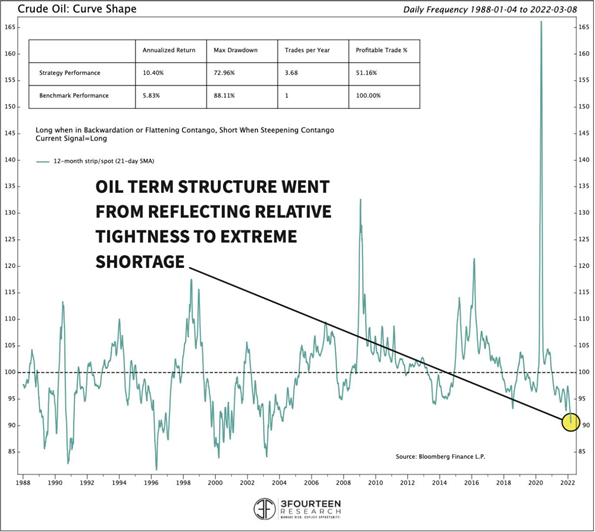
3Fourteen Research estimates the removal of Russian crude will expand the gap between supply and demand by roughly 2 million additional barrels per day with favorable assumptions (bringing the total gap to between 3.5 and 4.5 mmbpd).
We get to this rough calculation by assuming Russia exports approximately 6.5 mmbpd of crude. At the right price, post-sanctioning, China and India could sop up about 3.5 mmbpd (up about 1 million barrels, but held back by logistical and political constraints).
On the supply side, Saudi Arabia and the UAE are likely to boost production by another 1 million bpd. That leaves a two-million-barrel gap. U.S. and Iranian production could arrive in the coming months as well.
But, no matter how you run the numbers, there will be a massive gap and virtually no spare capacity on the other side of this.
With little relief coming from the supply side, demand destruction will balance the market. At what price does this begin? Right around the highs we have recently observed (~$130/bbl). At these levels, oil’s cost to the American economy balloons to 4%.
Persistent pricing between $130 and $150/bbl will bring the nation’s cost of crude oil up to around 4% to 5% and sap demand.
Globally, oil costs 6% of global gross domestic product, so oil is currently an even bigger drag on the global economy than it is for the U.S.
If prices persist at these levels ($130-$150), demand will stall and then fall. Put simply, an economic slowdown will materialize. However, a typical recession may not be enough to kill off sufficient demand to balance the market.
Recall, we estimate that a gap of approximately 4 million bpd will open between supply and demand without Russian oil flowing to the Western coalition. Going back to the 1970s, the average U.S. recession has reduced U.S. oil demand by about 1.5 million bpd.
Globally, the world lost just over 3 million bpd of demand during the Great Recession. Even this magnitude of demand softening would not be enough to close the projected deficit.
Only the COVID-19 crisis—and its attendant lockdowns—managed to destroy more than 4 million barrels of oil demand (around 11 million, peak to trough).
Bottom line: without Russian crude oil, stagflation is likely.
Implications for the Energy sector
In the fog of war, conclusions are scarce. But we do have one conviction: a new appreciation for energy security will emerge from the conflict. For investors, this may translate into better valuations for traditional energy stocks.
We can attempt to quantify an Energy sector rerating. Energy is the quintessential “top-down” sector. In order to get the Energy call “right” you must first establish a view on oil and the assorted energy commodity prices that dictate the operating environment (i.e., “top down”).
On a long enough timeline, oil is a mean-reverting asset. The market accounts for this tendency by assigning a high valuation to the Energy sector at oil troughs and a low valuation at oil peaks.
We compare the Energy sector’s earnings yield to the price of oil. The dynamic is apparent.
(Click on image to enlarge)

(Click on image to enlarge)

Given the market’s tendency to adjust Energy sector valuations based on oil price, we must control for crude before determining whether current valuations offer anything compelling.
We compare the forward earnings yield for the sector (less the risk-free rate) to the real price of crude. The red dot is where we stand at present.
The conclusion: after adjusting for oil, the Energy sector’s earnings yield is elevated (i.e., its valuation depressed) by about 40%, compared to historic norms.
Since 2018, capital has fled traditional energy. Poor returns, questionable terminal values, and an anti-fossil fuel zeitgeist have coalesced to push down Energy sector valuations (blue dots/regression trendline).
We believe the pendulum has swung too far. The Russia-Ukraine conflict will catalyze a new appreciation for energy security and traditional energy companies. Over the next few years, we expect Energy sector valuations to move closer to their historic multiple when adjusted for crude oil (purple line).
Based on this analysis, we should see multiples expand by about 40% (Energy earnings yield moves from 6.5% to 4.25%). Additional upside to the sector will come from expanding analyst estimates (this is a forward earnings yield analysis) and the shift higher in oil prices.
Finally, Energy’s negative correlation to the market offers attractive diversifying potential to quantitative analysts. Throughout 2022, the Energy sector has traded with a negative correlation to every other sector in the market. There are no other sectors with negative correlations to each other.
(Click on image to enlarge)

In effect, Energy equities are hedging two of the most acute risks facing the rest of the market: 1) an escalation between Russia and the West, and 2) persistent inflation driven by energy commodities.
(Click on image to enlarge)

(Click on image to enlarge)




Comments
Log in or sign up to join the conversation.