

Following futures positions of non-commercials are as of September 15, 2026.
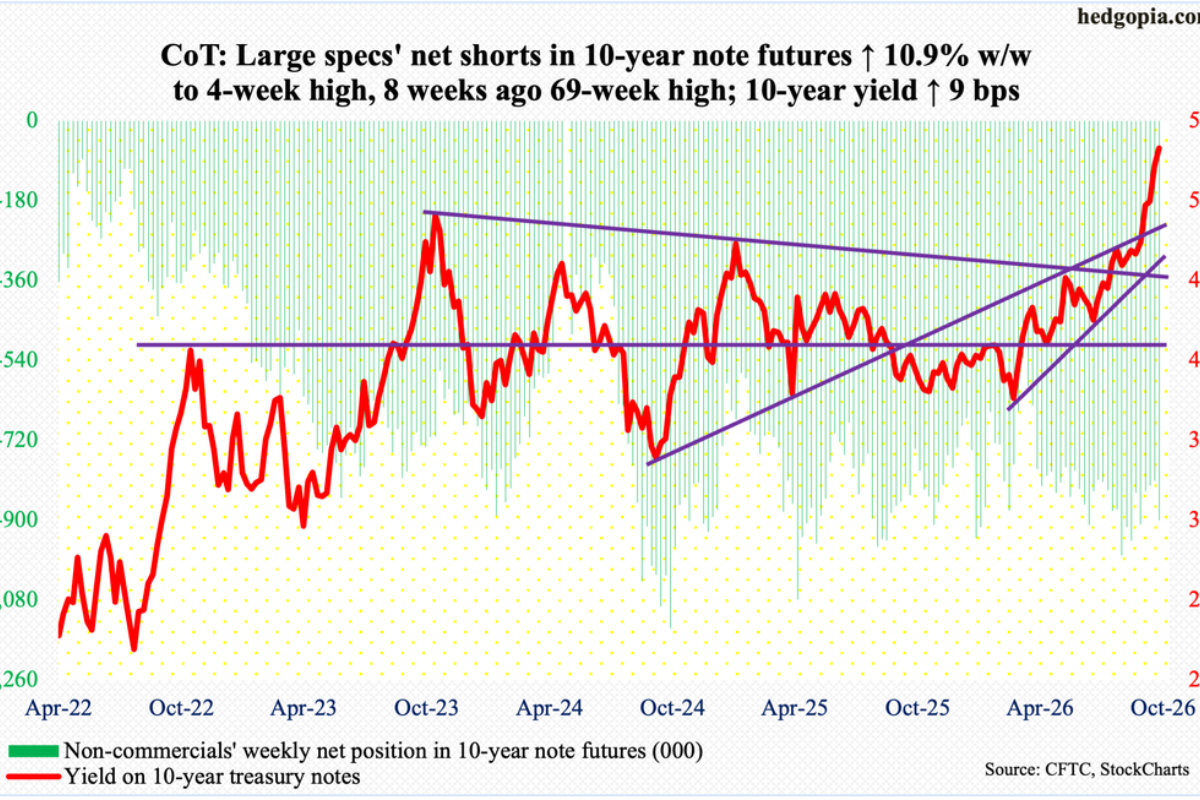
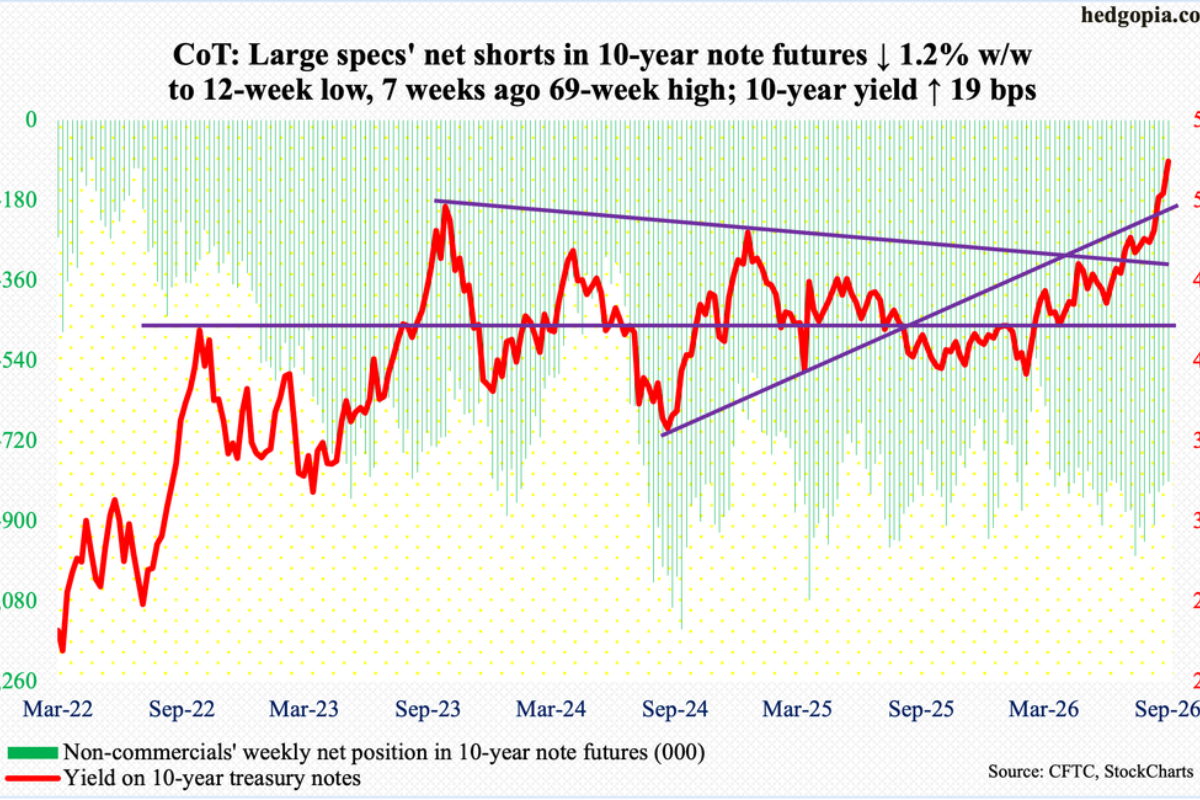
10-year note: Currently net short 821.2k, down 13.5k.
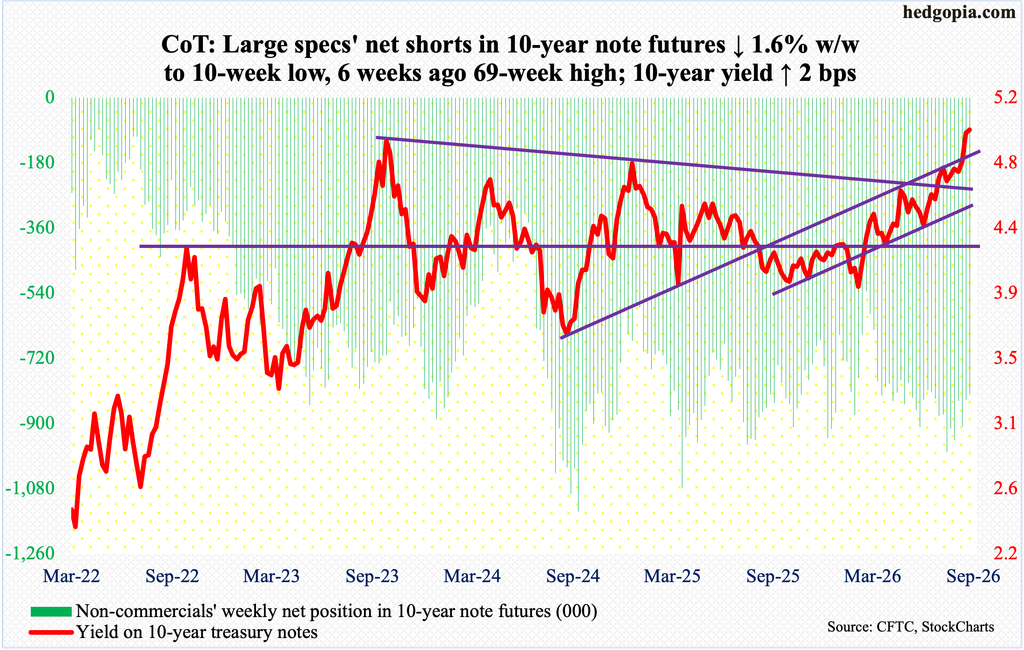
Markets were begging the Federal Reserve’s FOMC (Federal Open Market Committee) to hike, and the policy-making body did not disappoint, raising the fed funds rate by 25 basis points to between 3.75 percent and four percent – and in quite a fashion. The vote was unanimous. In the July meeting, the benchmark rates were held steady with three dissents.
This was the first hike in a little over three years. The fed funds rate had been left unchanged since last December when it was reduced by 25 basis points; this preceded a cut of similar magnitude in September and October. Earlier, rates reached a cycle high 5.25 percent to 5.50 percent in July 2023, followed by cumulative cuts of 100 basis points over three meetings in 2024.
The base rate has been pushed lower at a time when inflation – both CPI (consumer price index) and PCE (personal consumption expenditures) – have remained above the Fed’s stated goal of two percent for over five years. Newly appointed Chairman Kevin Warsh looks determined to change that.
“The plain fact is that inflation is too high and has been for too long,” Warsh told the post-meeting press conference on Wednesday. The Fed also published its quarterly Summary of Economic Projections, raising its forecast for PCE, which is its preferred gauge for inflation, to 3.7 percent by year-end and lifting GDP growth forecast to 2.3 percent.
Against this backdrop, the bigger question facing a Warsh Fed is, how much of the 175-basis-point easing since September 2024 deserves to be rolled back in the months and quarters to come? The CME’s FedWatch tool is forecasting with 58-percent probabilities that they would hike again in October, followed by two more by December next year to end between 4.5 percent and 4.75 percent, for a cumulative tightening of 100 basis points in the current cycle. Warsh likes to point out that he is someone who listens to markets for unfiltered signals. The CME odds are dynamic, hence fluctuate – a lot sometimes. But if the current projections bear out in the fullness of time, U.S. equities are acting too sanguine.
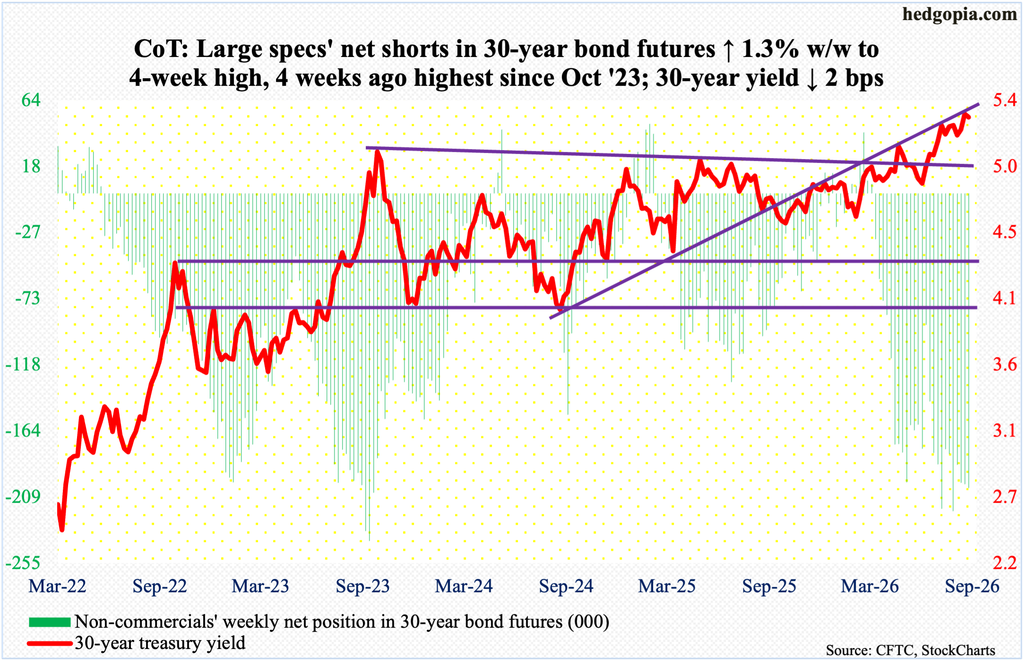
30-year bond: Currently net short 203.2k, up 2.6k.
Major US economic releases for next week are as follows.
New home sales (August) are due out Thursday. July sales tumbled 10.5 percent month over month to a seasonally adjusted annual rate of 607,000 units – a six-month low. January’s 576,000 set a 40-month low.
Durable goods (August) and University of Michigan’s consumer sentiment index (September, final) are scheduled for Friday.
Orders for non-defense capital goods ex-aircraft – proxy for business capital spending plans – inched lower 0.05 percent in July from June’s record $85.76 billion. From a year ago, orders were up 12.6 percent in July and 13.4 percent in June.
September’s preliminary count showed consumer sentiment decreased 3.9 points m/m to 47.8. In May, sentiment hit a record low 44.8.
WTI crude oil: Currently net long 118.1k, up 6.3k.
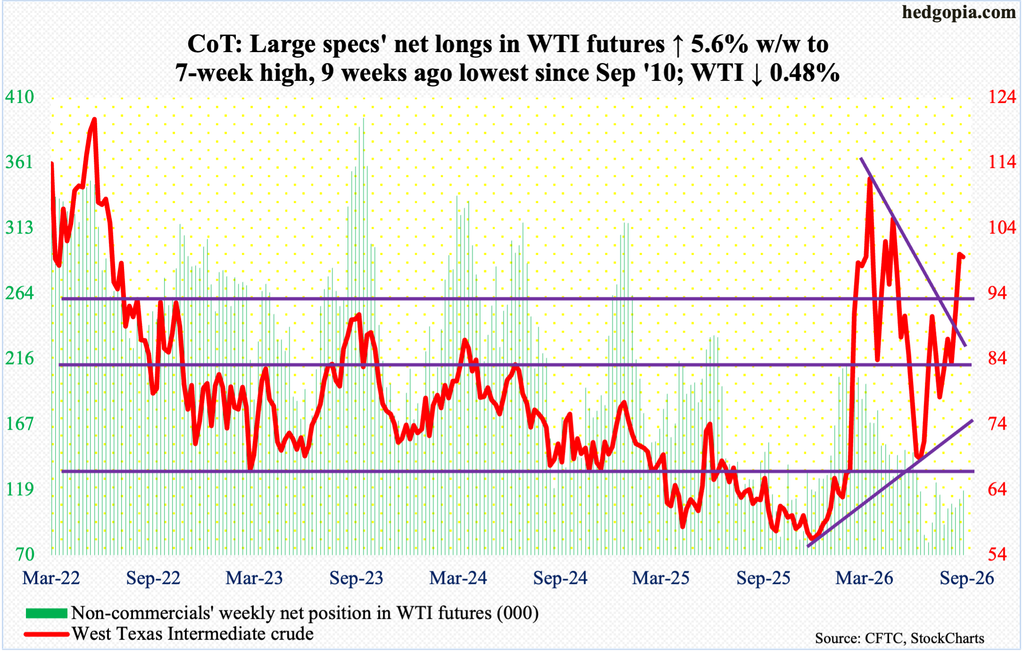
West Texas Intermediate crude looks ready to unwind the overbought condition it is in on both the daily and weekly. On Tuesday, it tagged $106.75 intraday, which was the highest since May this year. By the end of the week, the crude gave back 0.5 percent for the week to $99.57/barrel, for a weekly shooting star candle.
WTI has come a long way since July 2 when it bottomed at $67.04, filling a gap from March 2 when the crude had a six-session surge in the wake of the February 28 U.S. and Israeli military attack on Iran; it peaked at $119.48 on March 9. On February 27, WTI closed at $67.02, with a session high of $67.83 and a low of $64.85.
Nearest support lies at $92-$93.
In the meantime, as per the EIA, U.S. crude production in the week to September 11 was 13.944 million barrels per day, down 3,000 b/d week over week from record 13.947 mb/d. Crude imports rose 234,000 b/d to 7.058 mb/d. As did gasoline and distillate inventory, which respectively grew 794,000 barrels and 1.6 million barrels to 207.7 million barrels and 107.9 million barrels; crude stocks were down 640,000 barrels to 423.4 million barrels. Refinery utilization dropped a percentage point to 96.8 percent; two weeks ago, utilization at 98 percent was the highest since August 2018.
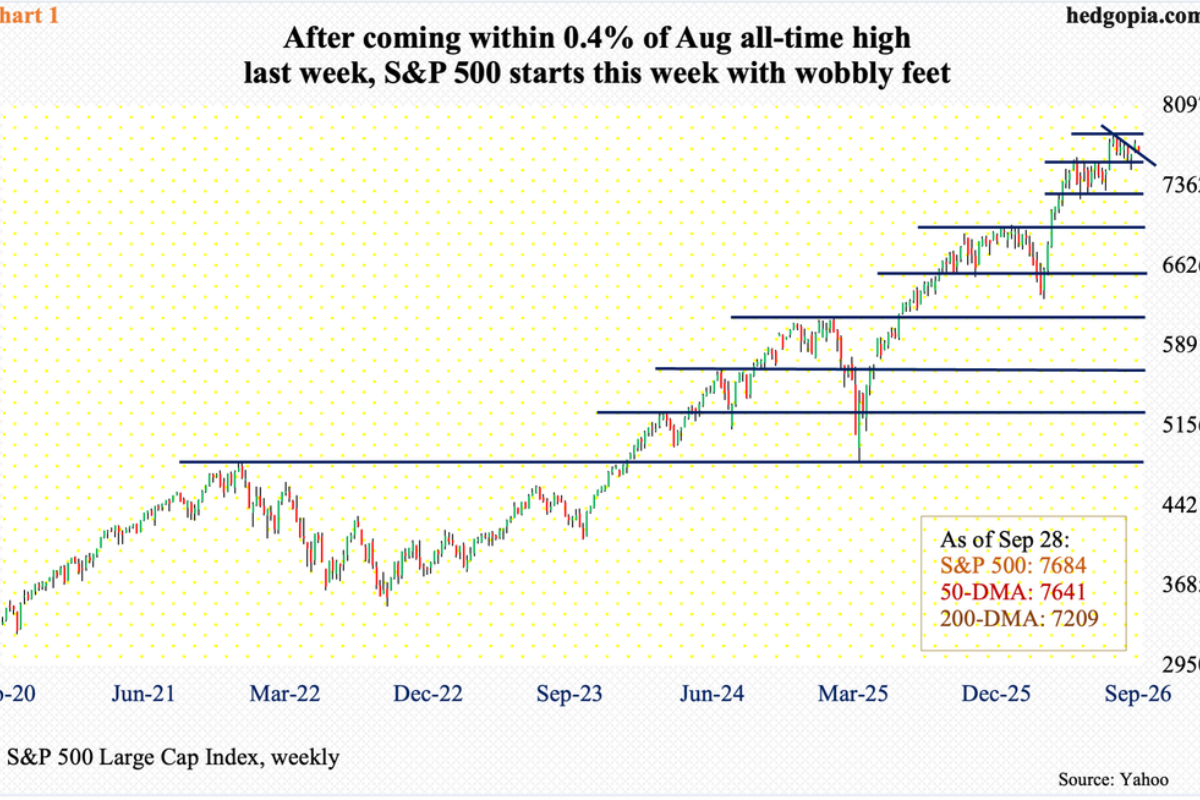
E-mini S&P 500: Currently net short 100.5k, up 24.4k.
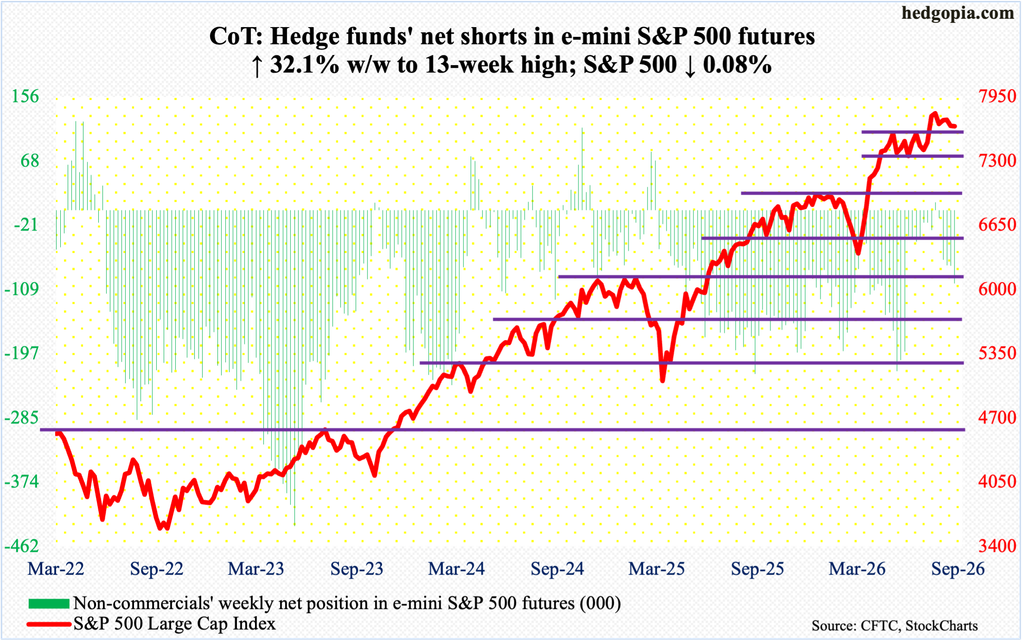
Since ticking an intraday high of 7817 on August 13, the S&P 500 has been caught in a pattern of lower highs, but a major support level is yet to yield.
The large cap index consolidated for a couple of months after peaking at 7621 on June 2, followed by a breakout on August 4. A retest of this breakout has gone on for a month now, but the bears have not had much success. They came very close this week as the index was down to 7507 intraday Wednesday, but the gains in the subsequent two sessions have tilted the near-term outlook in bulls’ favor.
The index edged lower 0.1 percent for the week to 7651, forming a candle that is yet to be decided if it is a hammer (bullish) or a hanging man (bearish). Also, on the daily, Friday formed the same candle, preceded by a spinning top on Thursday; both these candles showed up right at the 50-day moving average (7617).
The ball is in bulls’ court, as things stand. At 7700 rests trendline resistance from the August 13 peak.
Euro: Currently net short 27k, down 15.6k.
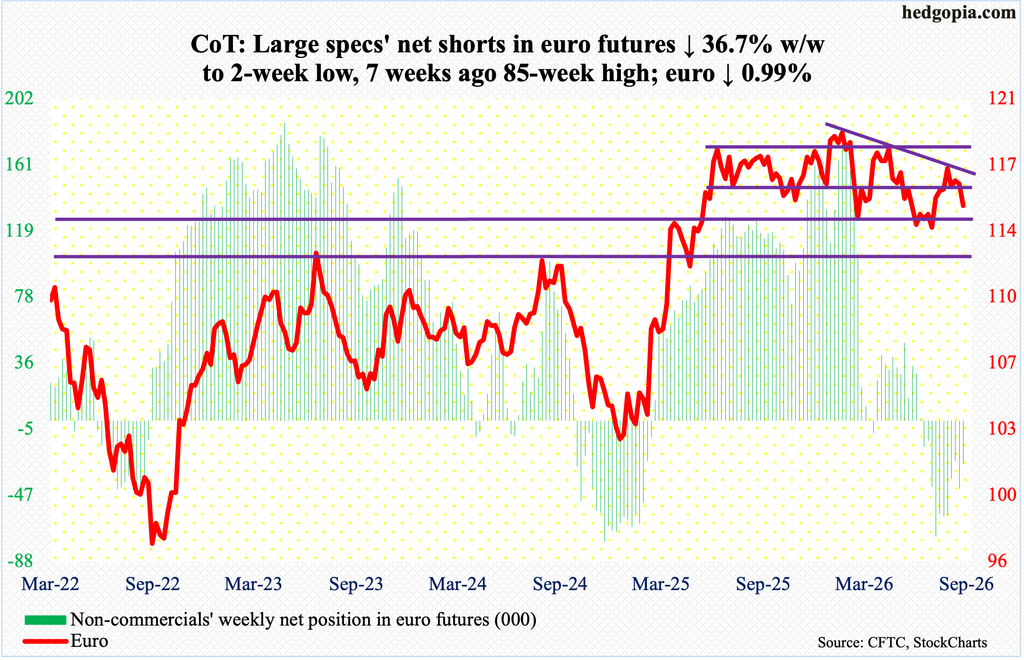
Last week’s hike by the European Central Bank was not enough to stop the euro from bleeding more this week, as it dropped one percent to $1.148, with the currency tagging $1.146 for three consecutive sessions through Friday. A relief rally is probably due.
For more than a year, the euro went back and forth between $1.14 and $1.18, marked by a four-and-a-half-year high of $1.208 posted on January 27, followed by a low of $1.132 on June 24. A declining trendline from the January high was broken six weeks ago, but euro bulls failed to build on it.
This week, the 50-day ($1.154) was compromised; this likely gets tested in the sessions ahead.
Gold: Currently net long 230.3k, down 1.6k.
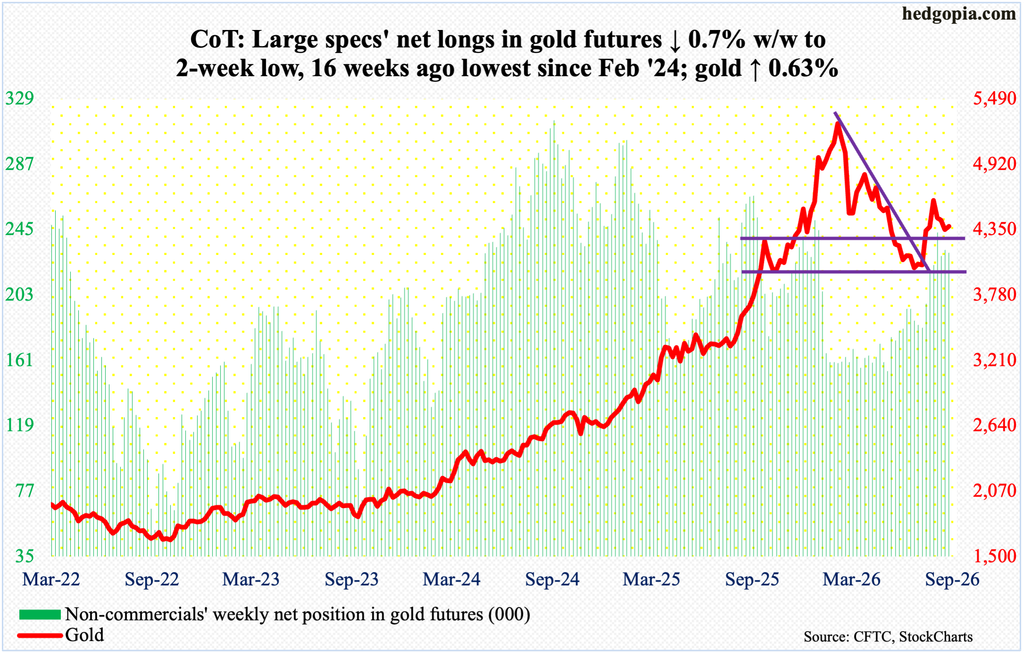
On August 25, gold ticked $4,697 intraday and reversed lower. Within three sessions of that high, the metal breached the 200-day (now $4,533). This Wednesday, the 50-day ($4,283) was lost as well, but only briefly. By Friday, gold finished at $4,378/ounce, up 0.6 percent for the week. This was the first up week in four.
Earlier, gold went from $3,312 in August last year – and $1,810 in October 2023 – to an all-time high 5,608 on January 29 this year. The drop since found support at $3,900-$4,000 for six consecutive weeks in June-July before turning up. The positive momentum ended on August 25.
But for now, gold bugs have an opportunity to add to this week’s gains. Gold ended the week right at crucial $4,370s-$4,380s. Once this level is won over, the 200-day is the next hurdle.
Nasdaq (mini): Currently net long 33.7k, up 12.8k.
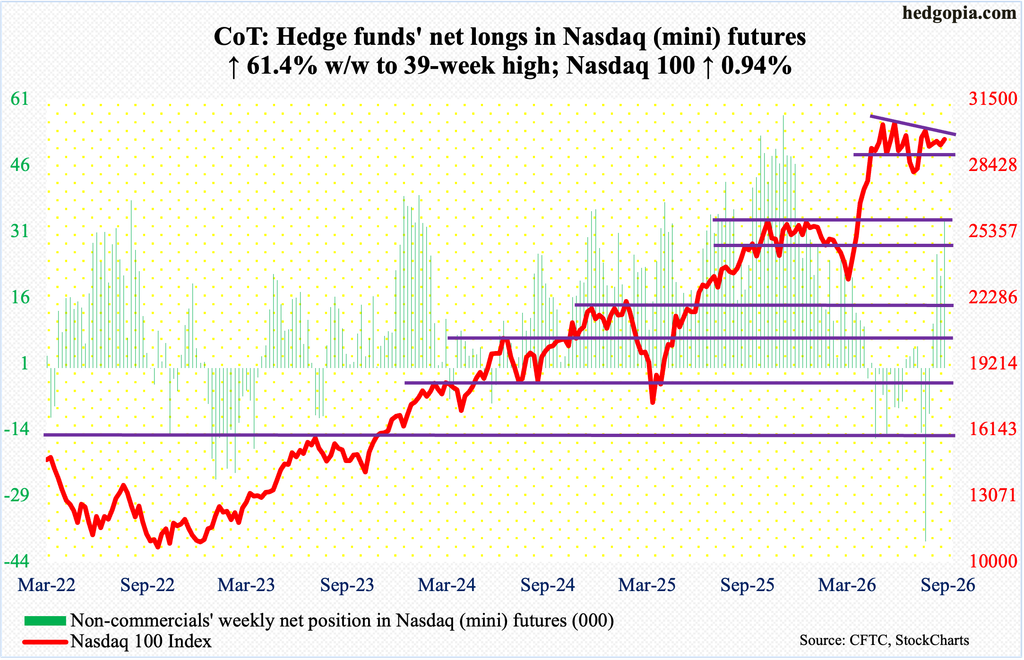
Wednesday’s intraday low 28753, and 28800s in the prior two sessions, successfully tested horizontal support at 28600s-28800s. The Nasdaq 100 ended the week up 0.9 percent to 29644, also reclaiming the 50-day at 29176.
The tech-heavy index nevertheless remains under a trendline from June 3 when it registered an all-time high 30762. Unlike other major indices like the S&P 500 and Russell 2000 (IWM), which posted fresh highs in August, the Nasdaq 100 is yet to surpass the June high. The trendline resistance thereof gets tested at 29800s, which the bulls have a shot at in the near term.
Russell 2000 mini-index: Currently net short 72.4k, down 10.5k.
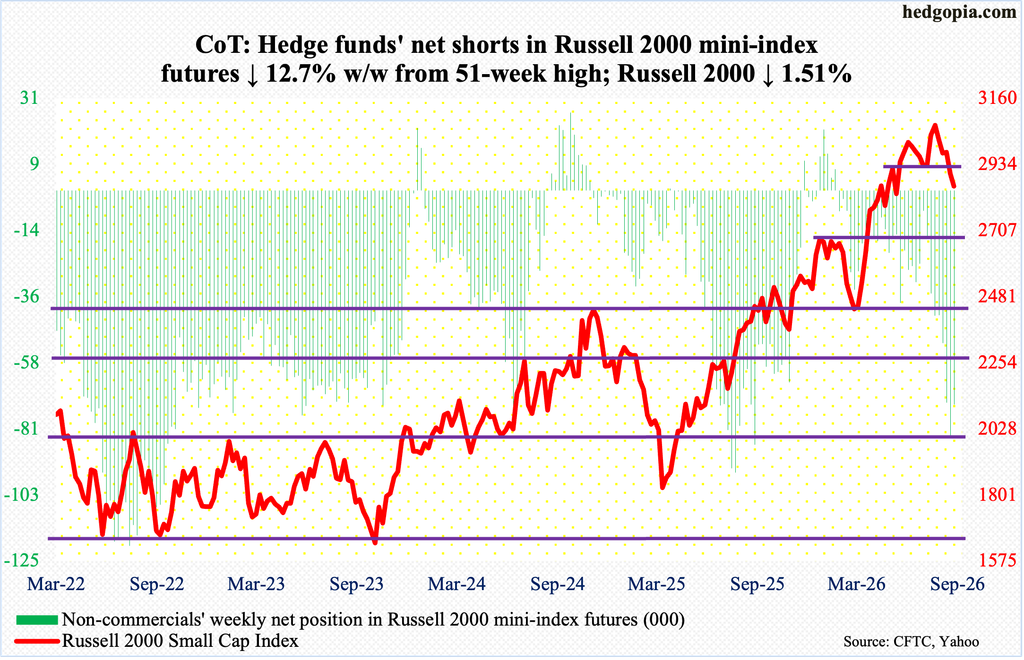
Already on the defensive since peaking at 3070 on August 14, the Russell 2000 came under more pressure this week as prospects for even higher rates in the months and quarters to come began to sink in. Small-caps inherently have a large exposure to the domestic economy versus their large- and mid-cap peers which also have an international presence; as well, small-caps tend to be leveraged with more exposure to the short end of the yield curve.
This week, the Russell 2000 declined 1.5 percent to 2860, which translates to a breach of horizontal support at 2880s. Last week, lateral support at 2940s was compromised. Even earlier, five weeks ago, there was a false breakout at 3040s.
The 50-day at 2969 has been lost, albeit only slightly. The 200-day lies at 2766, which in due course likely gets tested – particularly if small-cap bulls are unable to recapture 2880s the sooner the possible.
US Dollar Index: Currently net long 10.6k, down 7k.
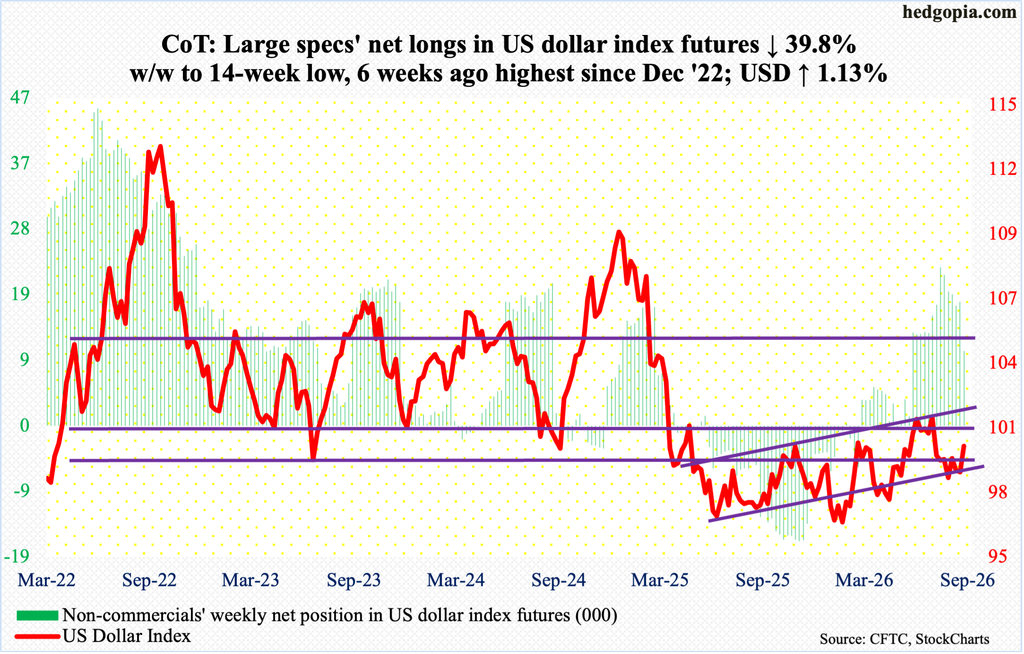
The US dollar index is at it again. It had been under pressure since getting rejected at 101-102 for six weeks in a row in June-July. The significance of 100 – or just north of it – goes back to March 2015.
This week, the index rallied as high as 100.56 on Friday, although dollar bulls failed to hang on to it, finishing the session/week at 100.21, up 1.1 percent for the week. Both the 50- and 200-day (respectively 99.90 and 99.16) were reclaimed this week.
The daily is getting extended. Ideally, should dollar bulls defend the 50-day on any weakness near term, the path toward the June-July high becomes clearer.
VIX: Currently net short 86.6k, down 8.2k.
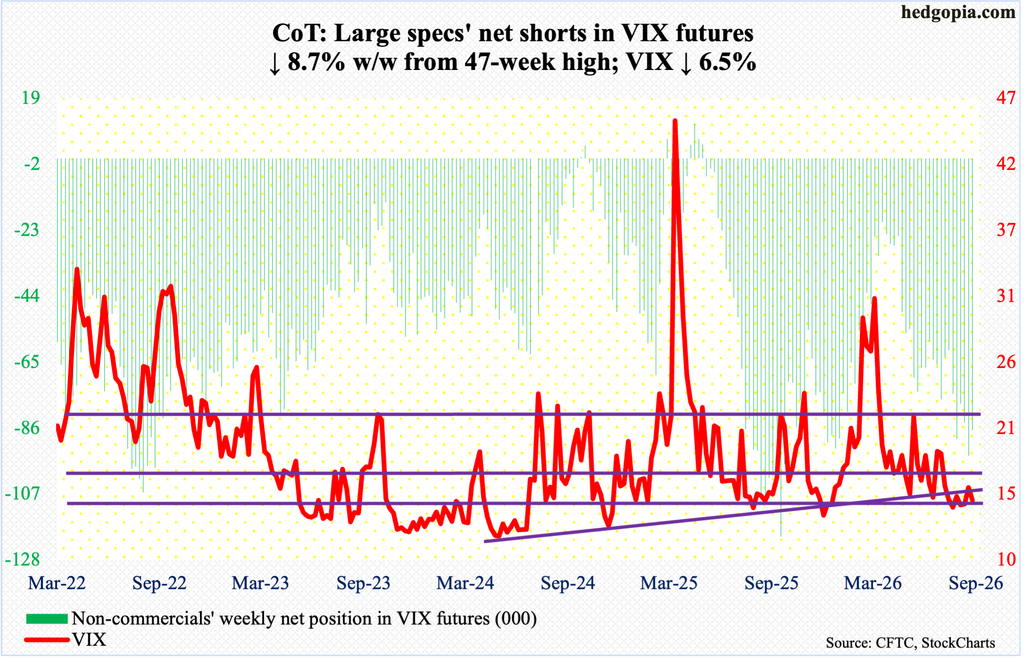
Volatility bulls this week had the best chance to retake the 200-day since late July, but they could not quite pull it off. At Wednesday’s session high 18.94, VIX was well past the 200-day at 18.08. In the next couple of sessions, however, volatility contracted quite a bit to end the week at 14.81, down 1.03 points for the week, also breaching the 50-day (16.17) in the process.
In the sessions ahead, low-14s is the path of least resistance. In this scenario, volatility bulls will then have an opportunity to defend 43, or thereabouts, on weekly RSI, which closed this week at 45.17; for nearly three years now, this metric has not broken 43, or thereabouts.
Thanks for reading!
Comments
Log in or sign up to join the conversation.