
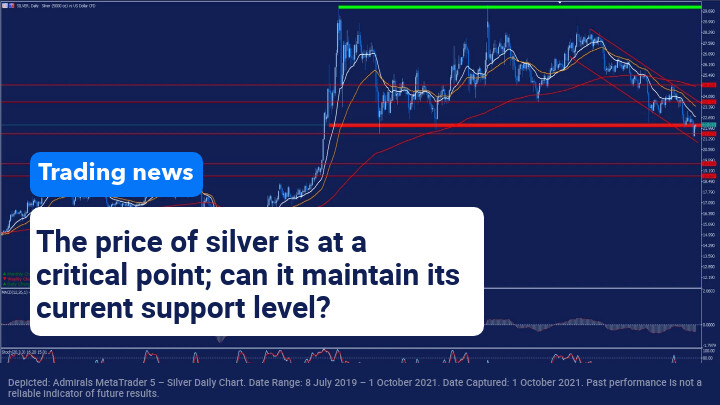
Following the outbreak of the pandemic, both gold and silver experienced a strong rally due to the resultant uncertainty generated in the financial markets. This uncertainty caused gold to surpass 2,000 USD per ounce, whilst silver reached levels close to 30 USD. However, since then, both precious metals are experiencing a strong consolidation, leading the price of silver to establish a strong and wide sideways range as we can see in the daily chart below.
Both the gold and silver markets are tightly controlled by the so-called bullion banks. These banks set prices by being able to create silver and gold on paper, in a similar way that private banks create money through deposits and liquidity reserves. However, this scenario may change radically after the forthcoming introduction of the Basel III accords in January 2022.
This reform will mean that gold in its tangible form will be classified as a zero-risk asset, while paper gold will not have this classification. This means that banks working with this type of product will have to increase their additional reserves, thereby increasing the demand for this type of asset, which could lead to a sharp increase in the volatility of these products, increasing both the price of gold and spot silver.
If we focus on silver, during the last few weeks we can observe that the price has been following a bearish channel, which has led it to momentarily break downwards through the important support level represented by the red band. We must not forget that, besides being a precious metal, silver is also used for industrial purposes due to its high conductivity, so the crisis in semiconductors and in the production of microchips could be negatively affecting the price. Although, as normality returns to this sector over the next year, the demand for silver for this type of use will progressively recover.
The price is at a critical point because the loss of this important support level could open the door to a further pullback in search of its next support levels at $19.655 and $18.847 per ounce; although, it is true that if the aforementioned forecasts are fulfilled, these could be a good point to consider long positions.
On the other hand, in order for the price to experience an upward momentum in the short term, it is important that it is able to maintain its current levels, although as long as it does not break its important bearish channel, we cannot expect much upside.
(Click on image to enlarge)

Depicted: Admirals MetaTrader 5 – Silver Daily Chart. Date Range: 8 July 2019 – 1 October 2021. Date Captured: 1 October 2021. Past performance is not a reliable indicator of future results.
Evolution of the last five years:
- 2020: 47.66%
- 2019: 15.20%
- 2018: -8.57%
- 2017: 6.34%
- 2016: 15.08%


Comments
Log in or sign up to join the conversation.