It combines the 200 day moving average with the difference between the 5 day and 35 day moving average.
The Golden Cross is a longer-term trend measure that utilizes the 200-day moving average.

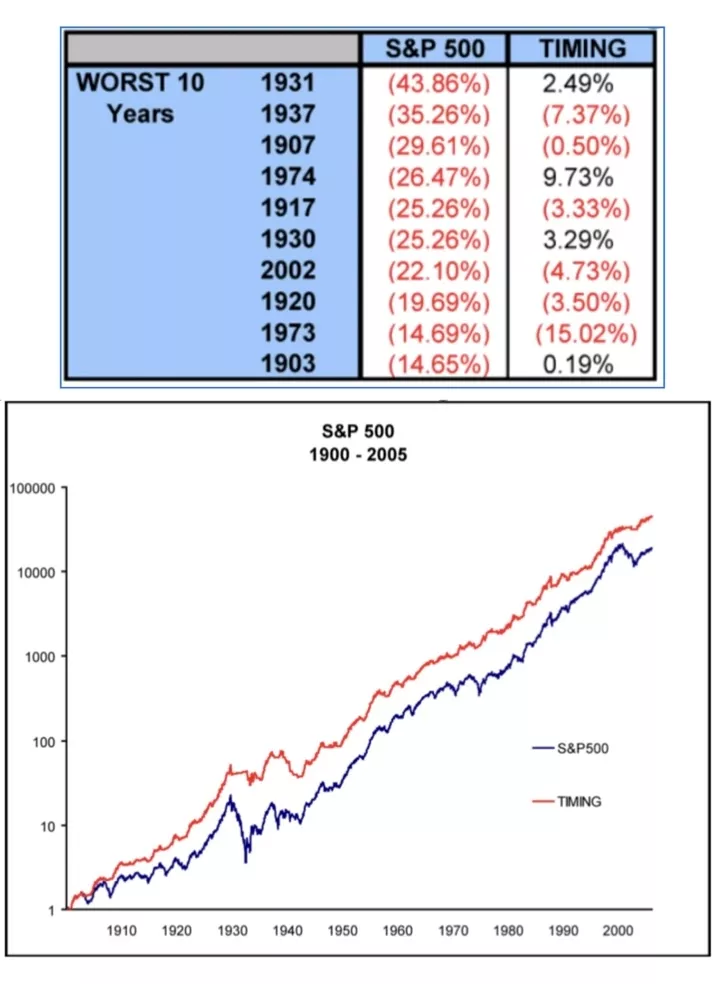
Meb Faber's paper, A Quantitative Approach to Tactical Asset Allocation, illustrates how using this trend approach can -

> Mitigate large losses and

> In the long-run build greater cumulative
wealth
Illustrations
Wave Prices & Volume properties indicate a primary wave trend down (or up) in stocks is occurring.Elliott Wave Oscillator (EWO) is simply the difference between a five-period and a thirty-five-period simple moving average. The EWO indicator is used to determine where an Elliott wave ends, and another begins.

When the oscillator begins to put in a series of lower highs while price puts in higher highs, a trend change occurs.

The basis of the Elliott principle, which quantifies market crowd behavior, works best in equities that (1) have lots of volume (liquidity) and (2) move according to fundamental forces of fear and greed on the part of many participants.

The Wave-Trend combines The Golden Cross with the Elliott Wave Oscillator’s range dimensions to develop a buy and sell signal.
Disclaimer:
These illustrations are not a solicitation to buy or sell any ETF.
Disclaimer:This and other personal blog posts are not reviewed, monitored or endorsed by
TalkMarkets. The content is solely the view of the author and TalkMarkets is not
responsible for the content of this post in any way. Our curated content which is
handpicked by our editorial team may be viewed here.




Comments
Log in or sign up to join the conversation.