


Image Source: Pixabay
October often evokes fear on Wall Street as memories are stirred of crashes in 1929, 1987, the 554-point drop on October 27, 1997, back-to-back massacres in 1978 and 1979, Friday the 13th in 1989, and the 733-point drop on October 15, 2008.
During the week ending October 10, 2008, Dow lost 1,874.19 points (18.2%), the worst weekly decline in our database going back to 1901, in percentage terms. March 2020 now holds the dubious honor of producing the worst, second and third-worst DJIA weekly point declines.
The term “Octoberphobia” has been used to describe the phenomenon of major market drops occurring during the month. Market calamities can become a self-fulfilling prophecy, so stay on the lookout and don’t get whipsawed if it happens.
But October has become a turnaround month — a “bear killer” if you will. Twelve post-WWII bear markets have ended in October: 1946, 1957, 1960, 1962, 1966, 1974, 1987, 1990, 1998, 2001, 2002 and 2011 (S&P 500 declined 19.4%). However, eight were midterm bottoms.
Over the last 21 years, October’s performance has been solid. Average gains over the last 21-years range from 0.9% by Russell 1000 and S&P 500 to 1.9% by NASDAQ. Small caps have still struggled though with Russell 2000 gaining a modest 0.6%
Post-election year October’s are neither great nor bad since 1953, ranking mid-pack across DJIA, S&P 500, NASDAQ, and Russell 1000 with gains averaging from 0.9% (DJIA & Russell 1000) to 1.4% (NASDAQ). DJIA has the best historical odds for gains having advanced in 12 of the last 17 post-election year Octobers.
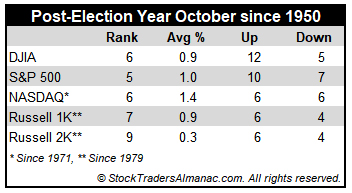
Despite the best average gain, NASDAQ actually has the worst record, declining in 6 of the last 12 post-election year Octobers. A 12.8% gain in 2001 boosts its average. Should a meaningful decline materialize in October it is likely to be an excellent buying opportunity, especially for any depressed technology and small-cap shares.



Comments
Log in or sign up to join the conversation.