
It is plain as day that massive central bank money printing and perpetual ZIRP do not rejuvenate the main street economy under conditions of “peak debt”. And the reason is so obvious that only Keynesian economists can’t grasp it.
To wit, if the balance sheets of households and businesses are tapped out—–then artificially suppressing interest rates cannot induce them to borrow even more money. Accordingly, spending is constrained to what can be funded from current income and cash flow after any set aside for new savings. In contrast to the four decades of the great credit expansion between 1970 and 2008, GDP can no longer be stimulated by incremental outlays derived from hocking household and business balance sheets.
The graph below of the long-term trend of household leverage—measured as total mortgage, credit card and other consumer debt compared to wage and salary income—–demonstrates the new normal. During the long period of credit expansion, the Fed’s resort to low interest rates to stimulate borrowing and spending worked because households started the period with relatively clean balance sheets. Accordingly, central bank monetary stimulus caused leverage ratios to be ratcheted higher and higher in response to each round of rate cutting.
Self-evidently that ratcheting process has stopped, and household leverage ratios have fallen, albeit to levels which are still aberrantly higher by historical standards. What this means is that after the peak debt inflection point was reached, the constraint on borrowing would not be the interest rate, as had been the case during the great credit inflation, but the availability of income to leverage.
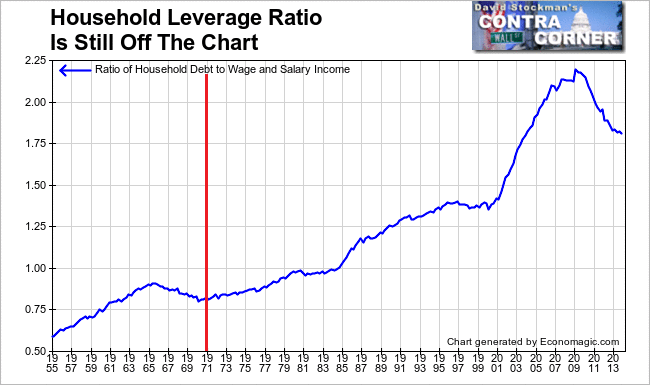
Household Leverage Ratio – Click to enlarge
So ZIRP is a vestigial relapse to a one-time era that was over and done by the time of the financial crisis. In technical terms, the so-called “credit channel” of monetary transmission is broken. Cheap interest rates were a one-time parlor trick that have no efficacy on today’s debt-saturated the main street economy.
As a practical matter, therefore, we have a 2% growth economy. That is, the economy is inching forward based on the natural regenerative power of capitalism and the slow accumulation of additional output from growth in productivity and labor hours employed. The Fed’s massive stimulus policies since the 2008 crisis have had virtually noting to do with the tepid recovery which has materialized.
The breakdown of the credit channel of monetary transmission is also why there has been no “V” shaped rebound like in cycles past. Stated simply, there has been no false turbo-charge of “aggregate demand” owing to the layering of credit based spending on top of consumption derived from current production and income. Rather than stealing growth from the future through the manipulations of the central bank, the US economy is now once again operating on its own two feet.
Needless to say, that’s also why there has been no “escape velocity” as was demonstrated one again this week in the data for December business sales and inventories released by the Census Bureau. And these data are important because they track the entire business economy—–retail, wholesale and manufacturing—-and can be viewed on a trend basis without the noise of seasonal maladjustments.
The story in the December data amounts to a 2% naturally recovery economy. Full stop. Total December business sales from all three sectors amounted to $1.4 trillion or a 2.8% gain over the prior year. When converted into “real” terms based on the GDP deflator, business sales were up by 1.9% during the past year.
That’s it—-the same plodding rate of expansion that has been in place since 2009. Moreover, the internals in this week’s report document in spades that monetary policy has lost its potency entirely, and that the $3.5 trillion expansion of the Fed’s balance sheets has done nothing for the main street economy.
The Census Bureau report also included numbers for sales by all US manufacturers. The monthly number for December 2013 had been $480.1 billion, but there was no acceleration whatsoever to be found in the result for the December just ended. That figure was $480.6 billion, meaning no change at all in manufacturers sales during the last year.
And that’s not an aberration. The graph below compares the peak-to-peak trend in manufactures sales during this cycle compared to the last one.In brief, during the 78 months after the June 2000 peak, manufacturers sales were up 20%. During the equivalent period since the July 2008 pre-crisis peak, manufacturers sales have gain just 0.4%.
Stated more graphically, sales in December were only $2 billion higher—–that is, a rounding error—than the were during July 2008 when Secretary Paulson assured the world that everything was ok, and that he would take care of the housing crisis and the imminent collapse of Fannie and Freddie owing to the bazooka lodged in his pocket.
![]()
Even as the Census Bureau report repudiated the talking heads of Wall Street, who spent the entire year of 2014 peddling the same old bogus story about “escape velocity” and the Fed’s alleged miracle cure, it contained some data on inventories that was not benign at all. During the past year business inventories rose by $65 billion or nearly double the gain in December sales over prior year.
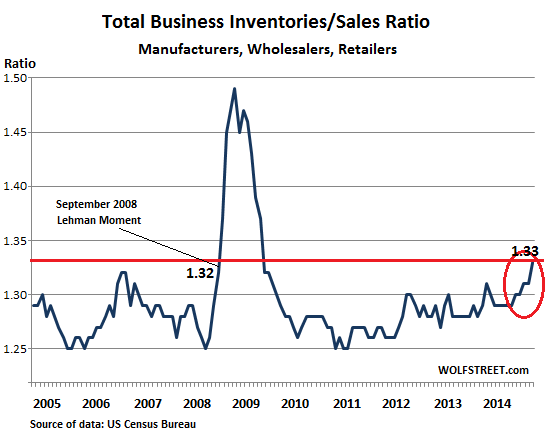
As a result, the inventory/sales ratio rose sharply. Indeed, as Wolf Richter’s post this morning cogently conveyed, the so-called I/S ratio is at an interesting point. Namely, the same elevated level that it was it in September 2008 when the roof fell in last time.
For all three combined, the inventories-to-sales ratio rose to 1.33 in December, after climbing methodically since the summer. The last time it was rising to this level was in September 2009 – the Lehman Moment – when sales up the entire channel were beginning to grind to a near halt, a terrible condition that morphed into the Great Recession. That propitious September, the inventories-to-sales reached 1.32, still a smidgen below where it is today:
So the truth is that the massive amounts of new cash conjured from thin air by the Fed in pursuit of ZIRP and QE never left the canyons of Wall Street. As it circulated through the primary dealers and ultimately back to the NY Fed as so-called “excess reserves” its round trip was not benign in the slightest.
In fact, ZIRP fueled the carry trades by making the cost to carry speculative positions virtually free, while the $3.5 trillion of new balance sheet created by the Fed in hardly six years became banking system collateral that was pledged and re-hypothecated over and over in the Wall Street casino.
Needless to say, free carry trade funding and an endless daisy chain of collateral fueled yet another vast inflation of financial assets, and the third reckless financial bubble of this century. When it finally bursts, the main street economy will take another pounding.
In short, even the plodding natural recovery capacity of capitalism is not enough—–at least, not when the central bank is in the hands of serial financial arsonists.


Comments
Log in or sign up to join the conversation.