

Image Source: Pexels
Inversion deepens (see sky blue line vs. green line):
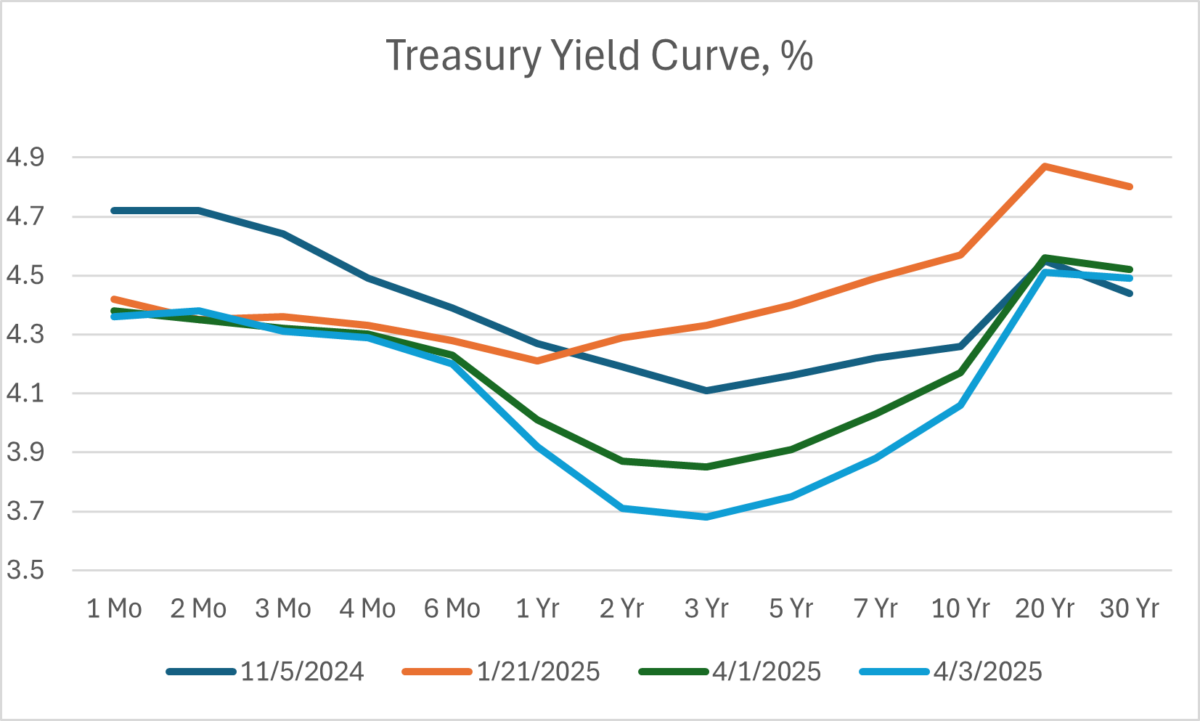
Figure 1. Treasury yield curve, %. Source: US Treasury.
Over time:
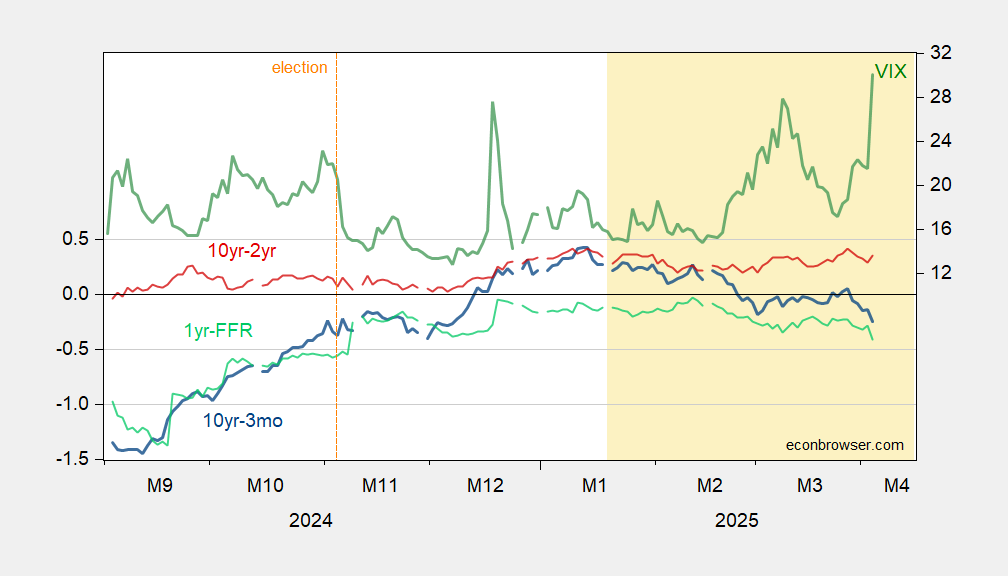
Figure 2: 10yr-3mo Treasury term spread (blue, left scale), 10yr-2yr Treasury term spread (red, left scale), 1yr-Fed funds (light green), all in %, VIX at close (green, right scale). Source: Treasury, CBOE via FRED.
More By This Author:
Negative GDP Growth In Q1?Forward Looking Implications Of Consumption Behavior In The Trump 2.0 Era
Term Spreads, Yield Curves, March 28, 2025


Comments
Log in or sign up to join the conversation.