

Our weekly Elliott Wave analysis reviews the EUR/USD, the Bitcoin cryptocurrency, and this time around, we add Gold (XAU/USD) instead of the US30 chart.
The stock markets have been moving slowly whereas the Gold chart seems to be making an interesting retracement within a strong uptrend.
EUR/USD
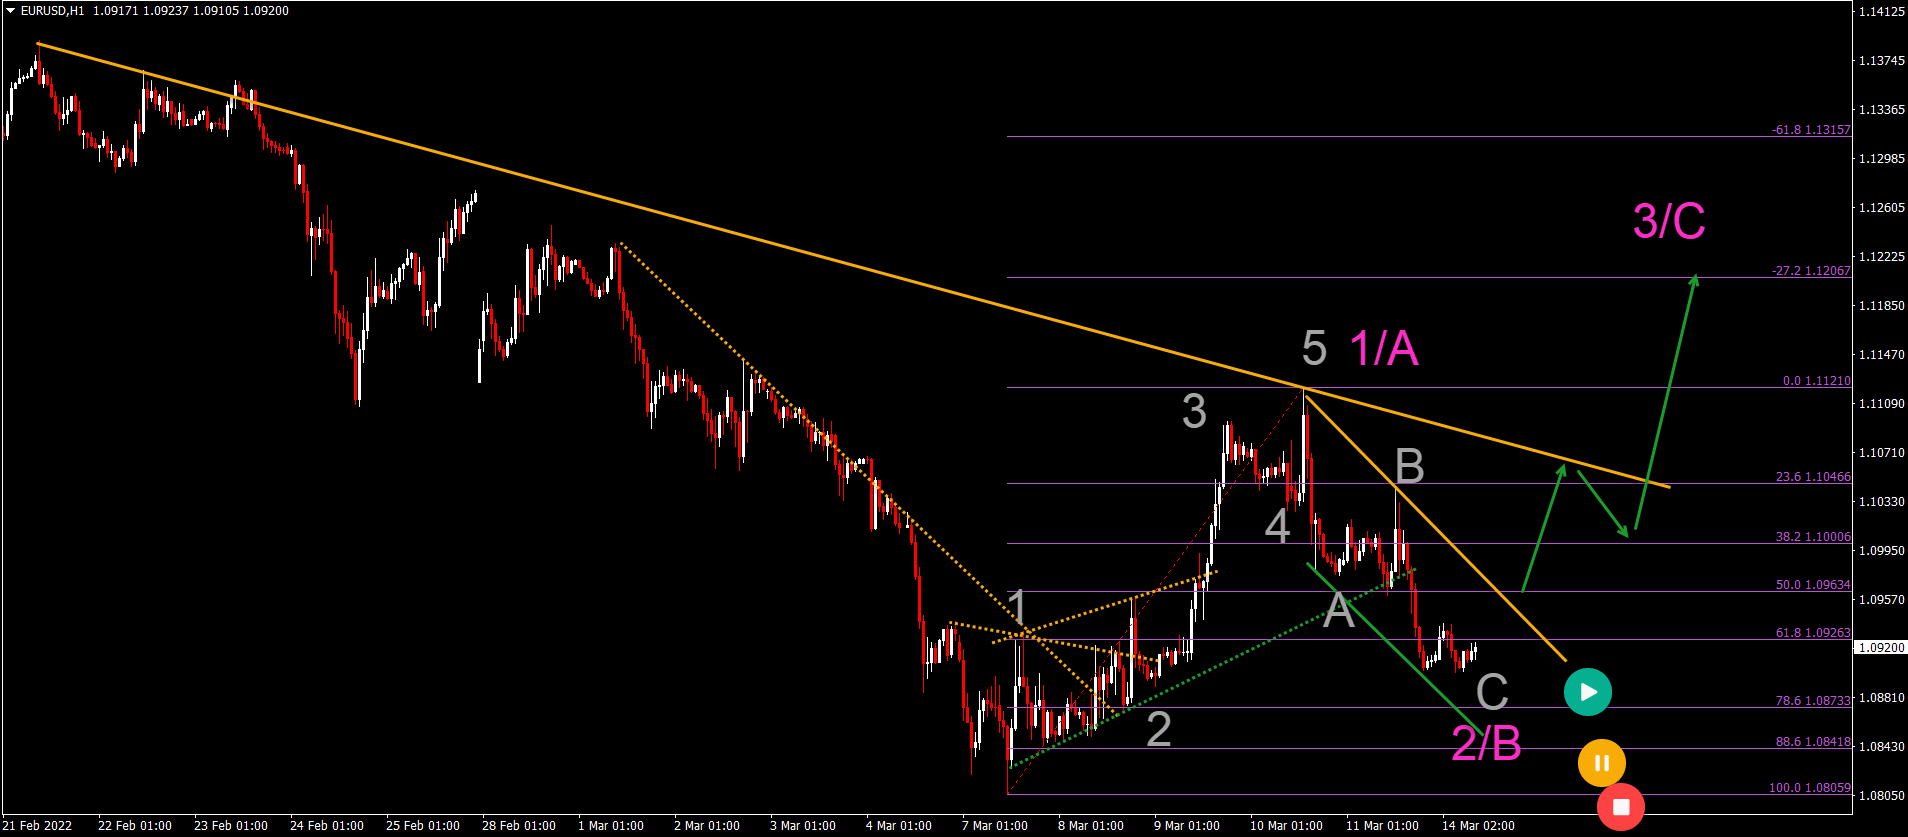
The EUR/USD is in a downtrend but price action is showing serious bullish signals:
- The EUR/USD made 5 waves up (gray), which indicates a wave 1 or A of a larger ABC zigzag pattern (pink).
- A bearish ABC retracement (gray) seems to be taking place within wave 2 or B (pink).
- A break (green arrows) above the bearish channel could indicate the start of a wave 3 or C (pink) towards Fibonacci targets.
- A break below the bottom, however, invalidates the expected bullish price swing and indicates a continuation of the downtrend towards 1.0750.
(Click on image to enlarge)
BTC/USD
Bitcoin (BTC/USD) seems to be building a triangle chart pattern:
- BTC/USD remains in the triangle pattern as long as price action respects the top and bottom.
- The triangle looks more bullish due to the strong push-up in wave A (pink).
- Price action could be completing an ABCDE (gray) within wave B (pink) now.
- A break above the resistance (orange) lines could confirm the start of wave C (pink).
- The main targets are the Fibonacci levels at 48k and 52k.
- A break below the support (green) line could indicate a larger retracement. A wave C (C2 gray) could finish at the 78.6% Fibonacci retracement level.
- A break below the bottom, however, would invalidate the ABC (pink) pattern.
(Click on image to enlarge)

Gold (XAU/USD)
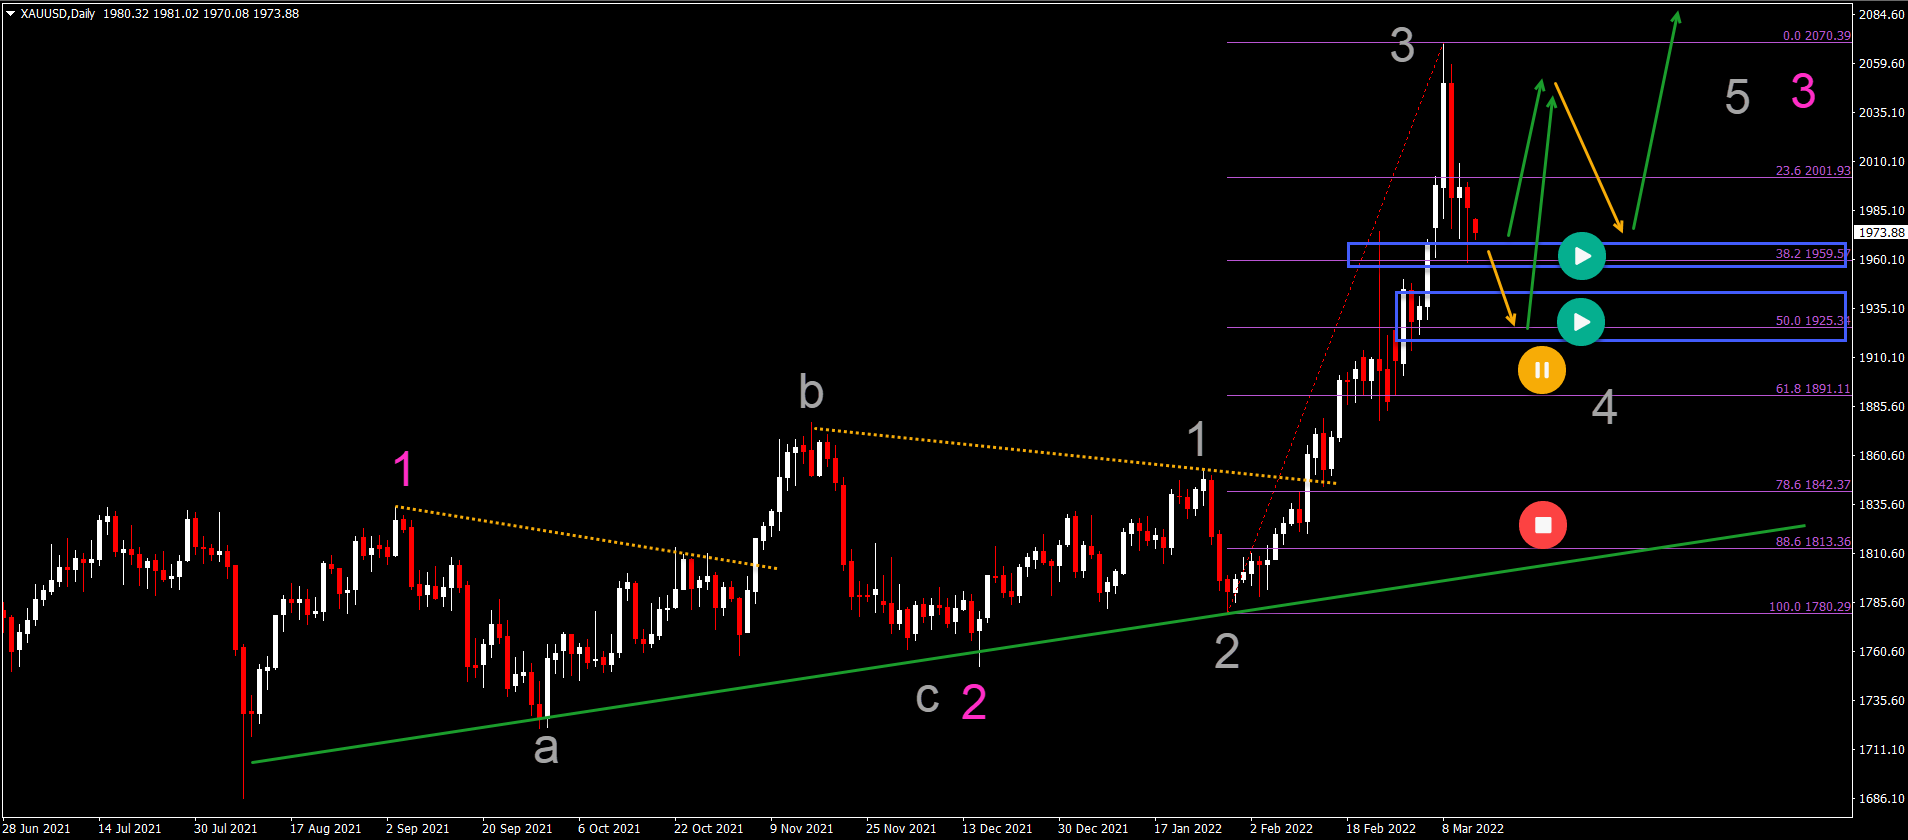
XAU/USD has been in a strong rally ever since the retracement found support around $1750:
- The strong bullish impulse seems to be wave 3 (gray).
- The bearish retracement is probably a wave 4 (gray).
- Wave 4 remains likely as long as the price respects the shallow 38.2% and 50% Fibonacci retracement levels.
- A deeper retracement places the bullish analysis on hold.
- Wave 4 usually is lengthy and choppy. A triangle pattern could emerge here.
- The main bullish targets are $2150 and $2250.
(Click on image to enlarge)



Comments
Log in or sign up to join the conversation.