

Please find here below this week's wave analysis on the EUR/USD, GBP/USD and USD/JPY daily, weekly and monthly charts.
EUR/USD
The EUR/USD could be in a new downtrend via a wave 1-2 (brown) but it invalidates the wave 2 (green/brown) if it manages to break above the 100% Fibonacci at 1.13. A break below support (green) would confirm the potential bearish reversal.
Daily chart:

The EUR/USD could still be in a deep wave 2 (green) retracement but bullish breakout above 1.13 changes the wave structure.
Weekly chart:
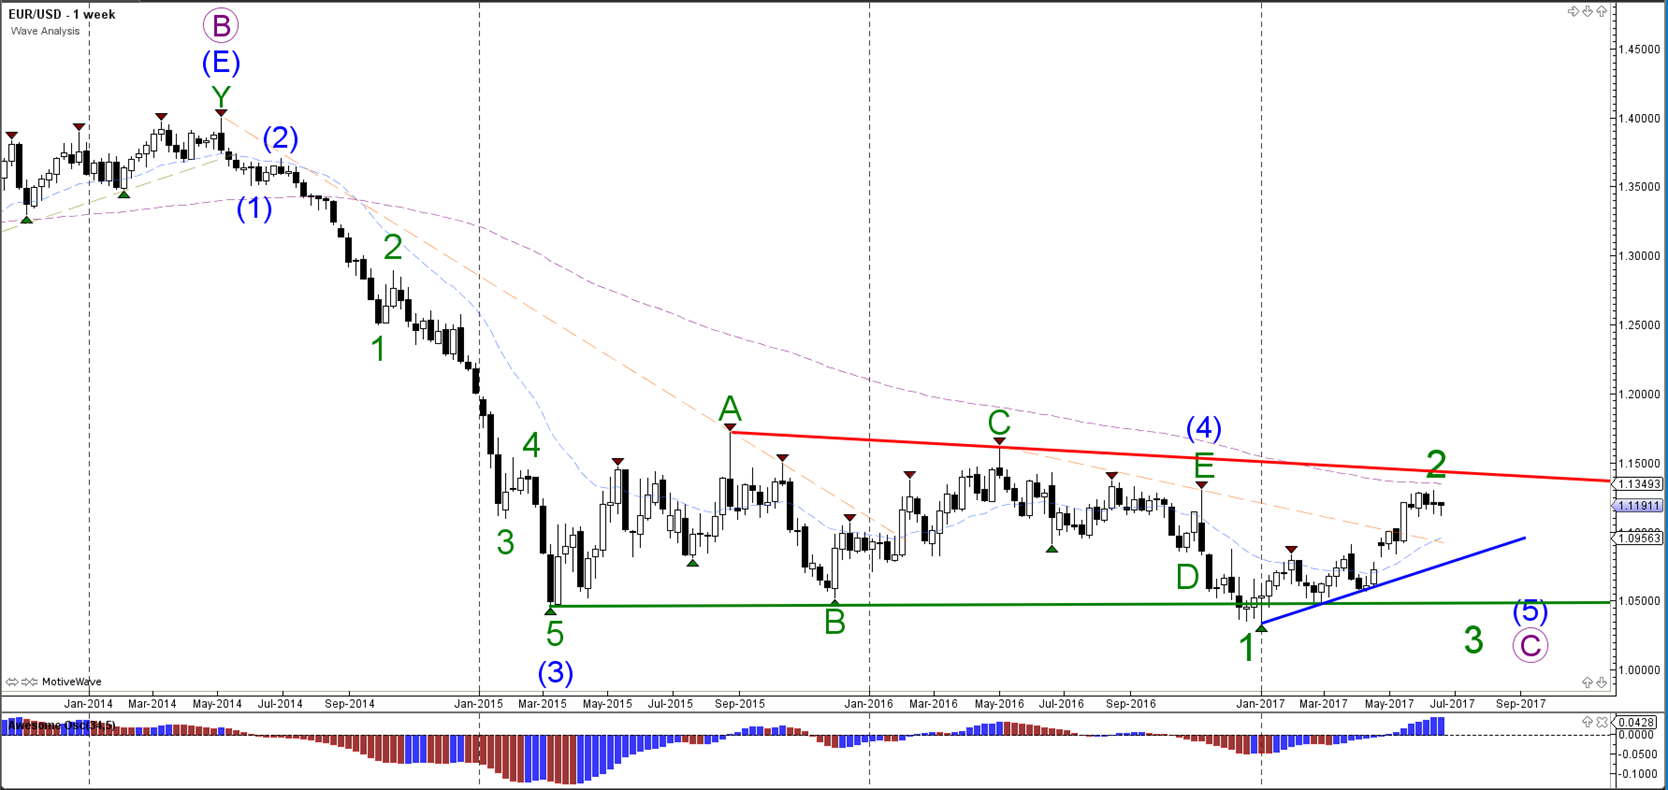
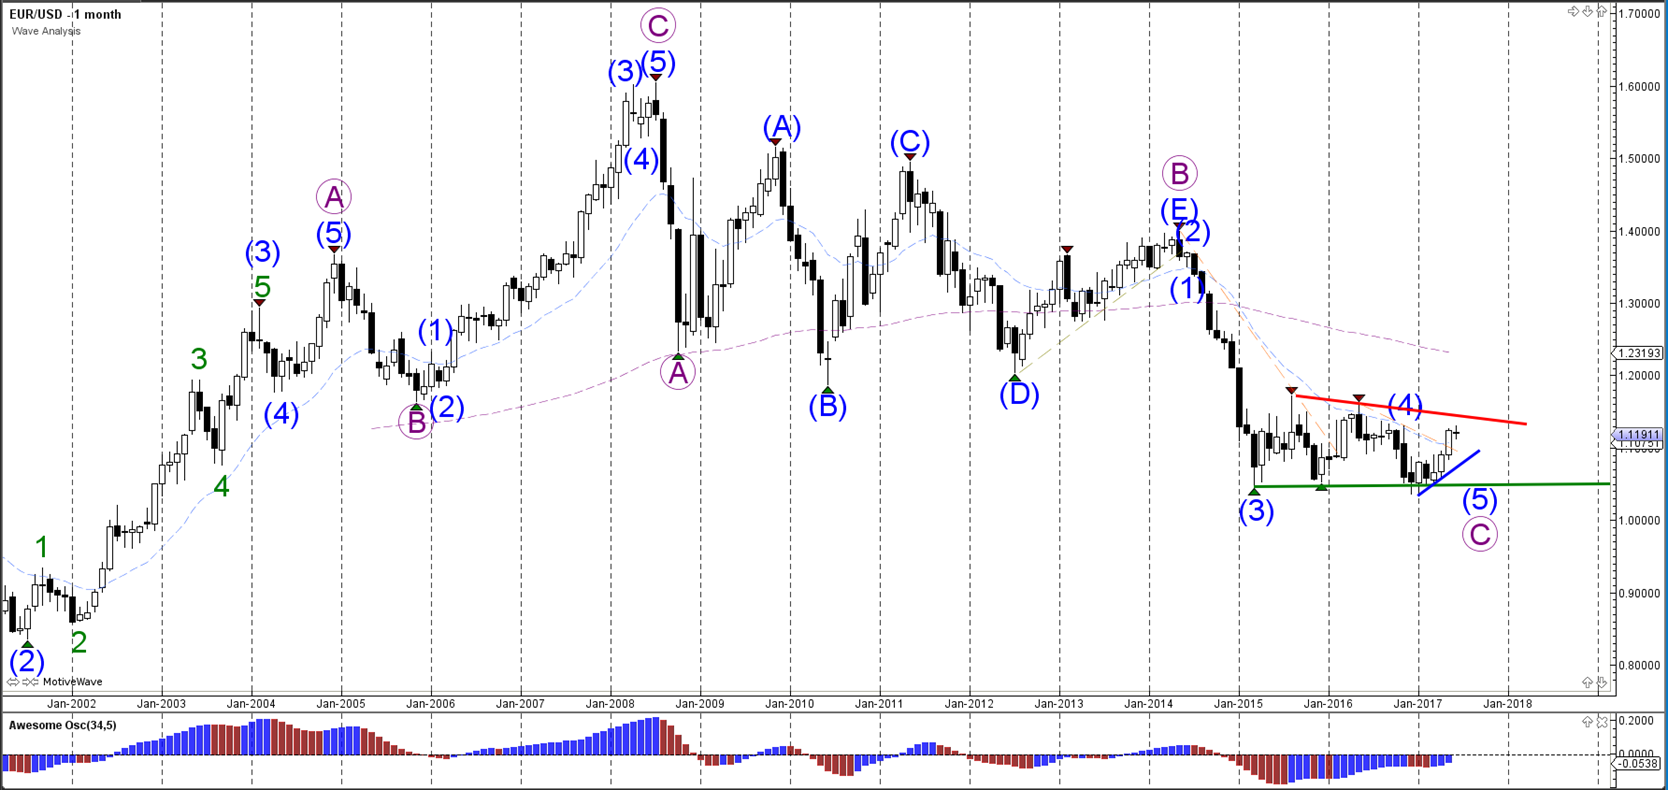
The EUR/USD is potentially building a larger correction between support (green/blue) and resistance (red).
Monthly chart
GBP/USD
The GBP/USD is probably building a wave 1-2 (blue) within wave 3 (red) unless price manages to break the 100% Fibonacci level of wave 2 (blue).
Daily chart:

The GBP/USD is most likely building a bullish retracement to the resistance levels (red/orange) but a break above those resistance levels would change the wave structure. All in all, the weekly chart is showing a sideways consolidation within a larger downtrend.
Weekly chart:
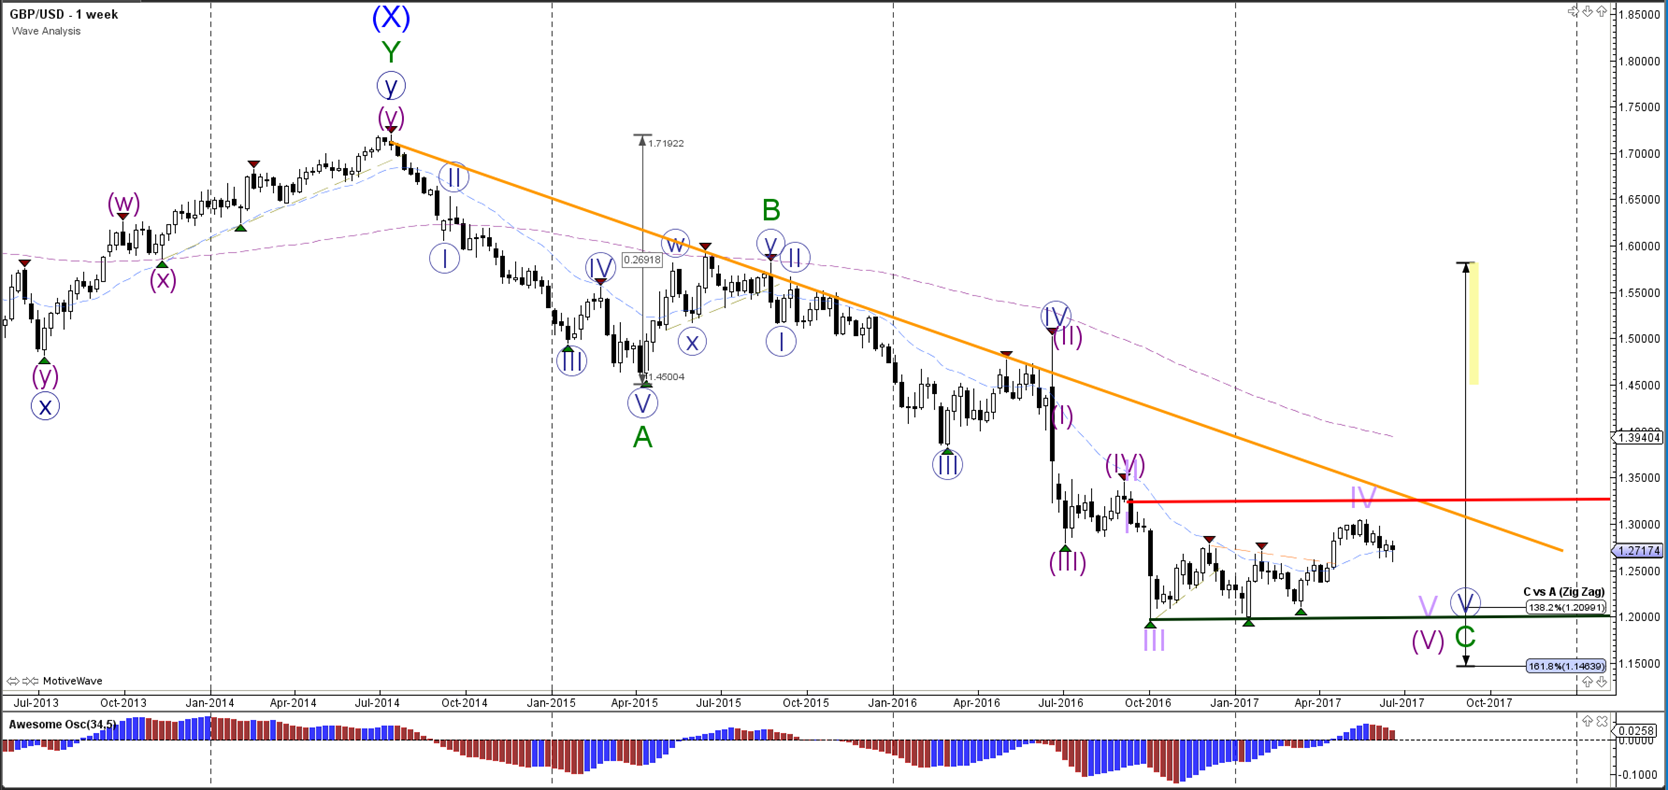
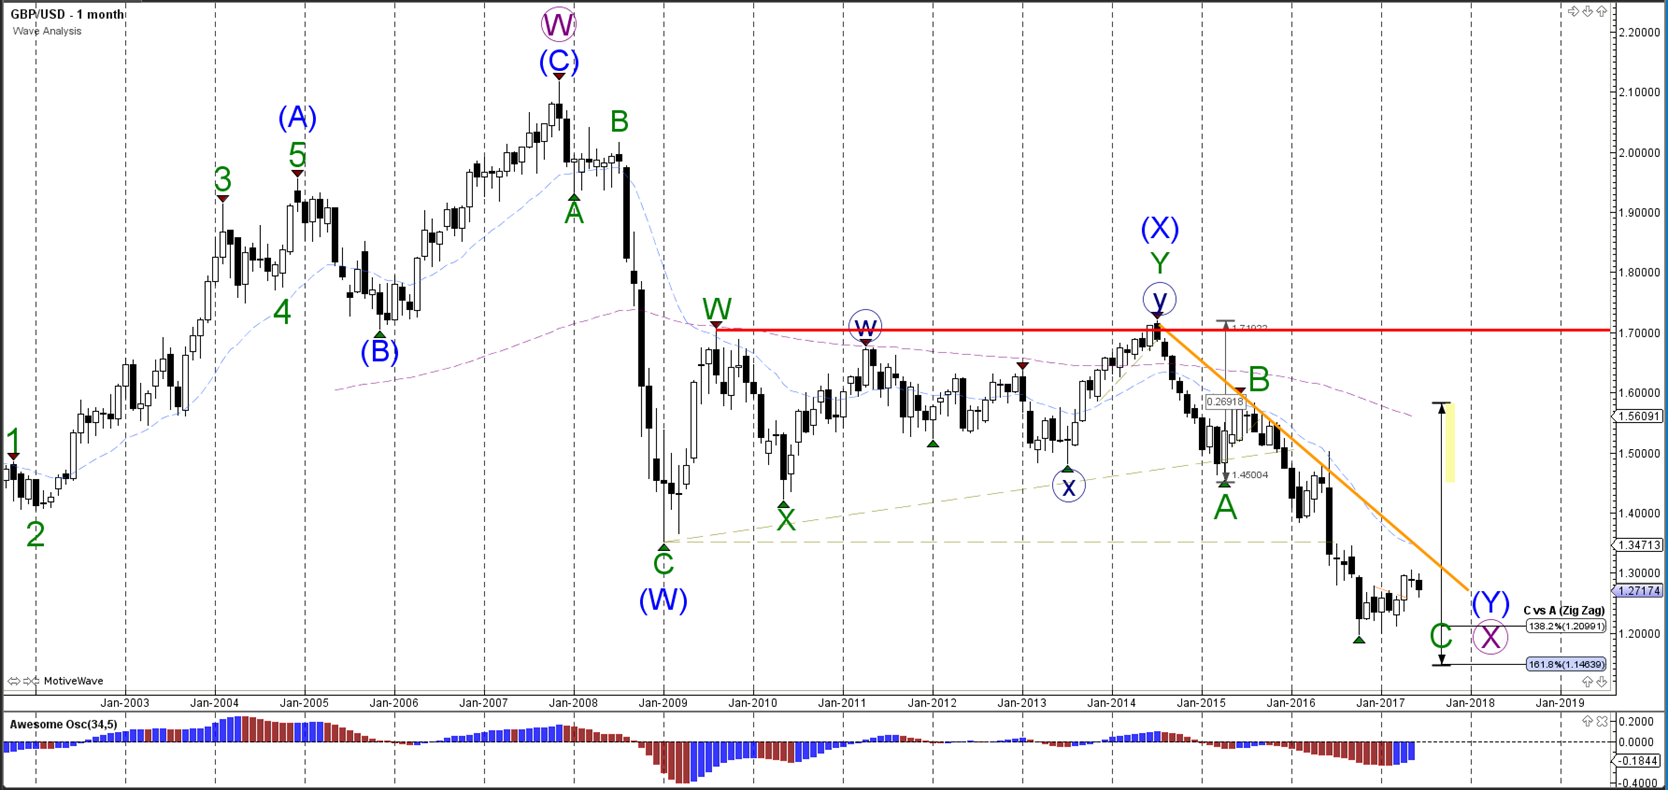
The GBP/USD has been in a downtrend as part of an ABC bearish zigzag (green), which could be completed if price manages to break the resistance on the weekly chart.
Monthly chart:
USD/JPY
The USD/JPY could you use the smaller support levels (green) to build a bullish continuation within wave C (brown).
Daily chart:

The USD/JPY could be retracing back to the Fib levels of wave B (green) via a WXY (blue).
Weekly chart:

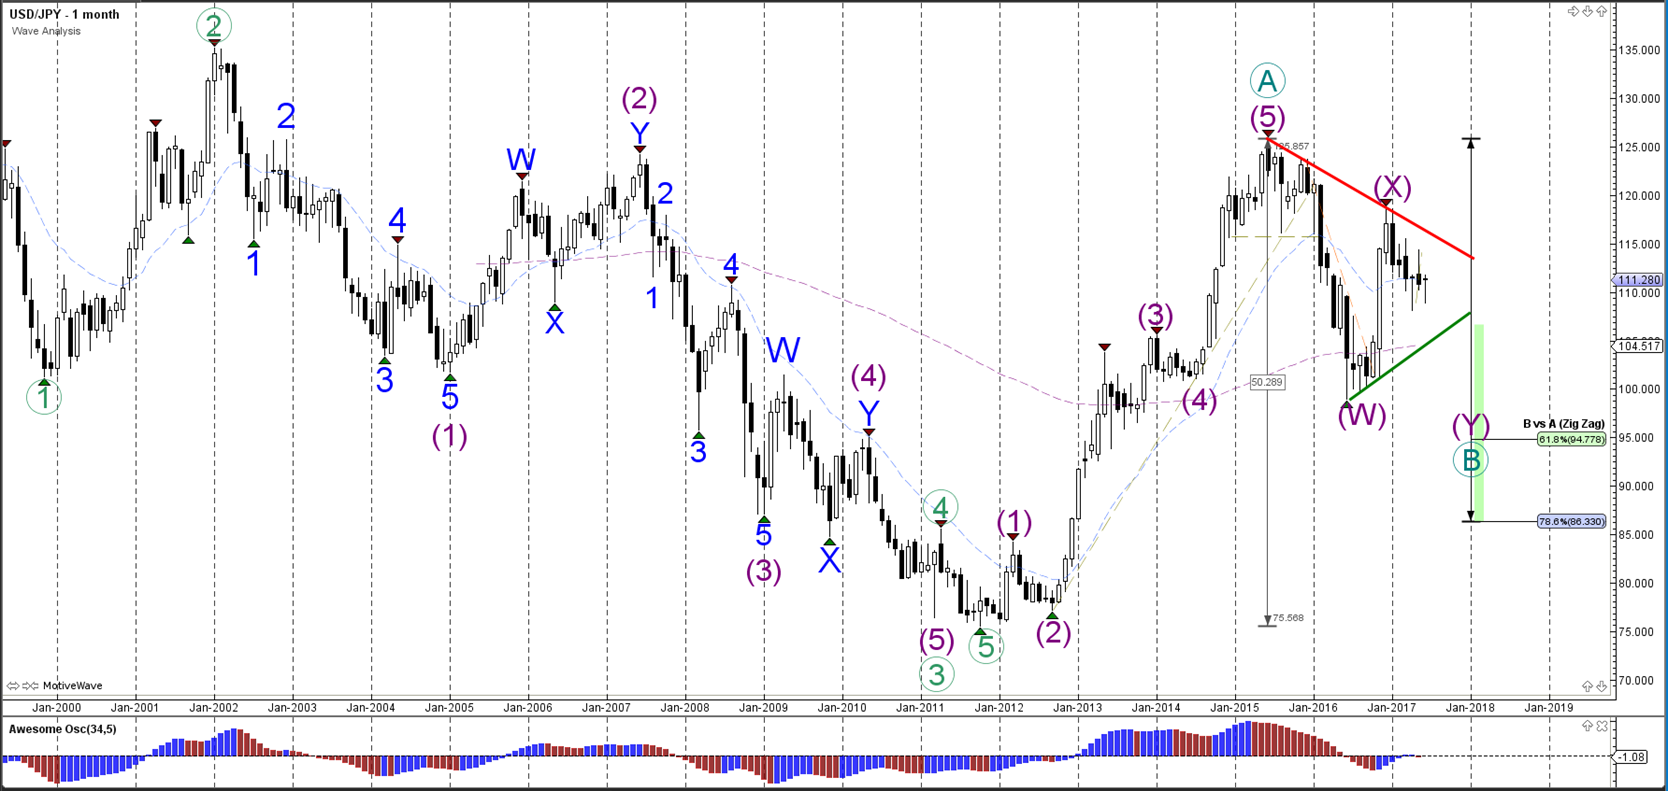
The USD/JPY is building a triangle correction (red/green lines) or correcting towards the Fibonacci levels of wave B (green).
Monthly chart:



Comments
Log in or sign up to join the conversation.