
Here is the opening statement from the Department of Labor:
SEASONALLY ADJUSTED DATA
In the week ending August 29, the advance figure for seasonally adjusted initial claims was 881,000, a decrease of 130,000 from the previous week's revised level. The previous week's level was revised up by 5,000 from 1,006,000 to 1,011,000. The 4-week moving average was 991,750, a decrease of 77,500 from the previous week's revised average. The previous week's average was revised up by 1,250 from 1,068,000 to 1,069,250.
The advance seasonally adjusted insured unemployment rate was 9.1 percent for the week ending August 22, a decrease of 0.8 percentage point from the previous week's unrevised rate. The advance number for seasonally adjusted insured unemployment during the week ending August 22 was 13,254,000, a decrease of 1,238,000 from the previous week's revised level. The previous week's level was revised down by 43,000 from 14,535,000 to 14,492,000. The 4-week moving average was 14,496,250, a decrease of 709,000 from the previous week's revised average. The previous week's average was revised down by 10,500 from 15,215,750 to 15,205,250.
REVISION TO SEASONAL ADJUSTMENT FACTORS
Beginning with the Unemployment Insurance (UI) Weekly Claims News Release issued Thursday, September 3, 2020, the methodology used to seasonally adjust the national initial claims and continued claims will reflect additive factors as opposed to multiplicative factors.
Seasonal adjustment factors can be either multiplicative or additive. A multiplicative seasonal effect is assumed to be proportional to the level of the series. A sudden large increase in the level of the series will be accompanied by a proportionally large seasonal effect. In contrast, an additive seasonal effect is assumed to be unaffected by the level of the series. In times of relative economic stability, the multiplicative option is generally preferred over the additive option. However, in the presence of a large level shift in a time series, multiplicative seasonal adjustment factors can result in systematic over- or under-adjustment of the series; in such cases, additive seasonal adjustment factors are preferred since they tend to more accurately track seasonal fluctuations in the series and have smaller revisions.
Prior to September 2020, the seasonally adjusted unemployment insurance claims series used multiplicative seasonal adjustment factors. Starting in September Bureau of Labor Statistics staff, who provide the seasonal adjustment factors, specified these series as additive. In accordance with the usual practice, the seasonal adjustment models and factors will be reviewed at the beginning of each calendar year, when prior years of seasonally adjusted estimates will be subject to revision. [See full report]
This morning's seasonally adjusted 881K new claims, down 130K from the previous week's revised figure, was better than the Investing.com forecast of 950K.
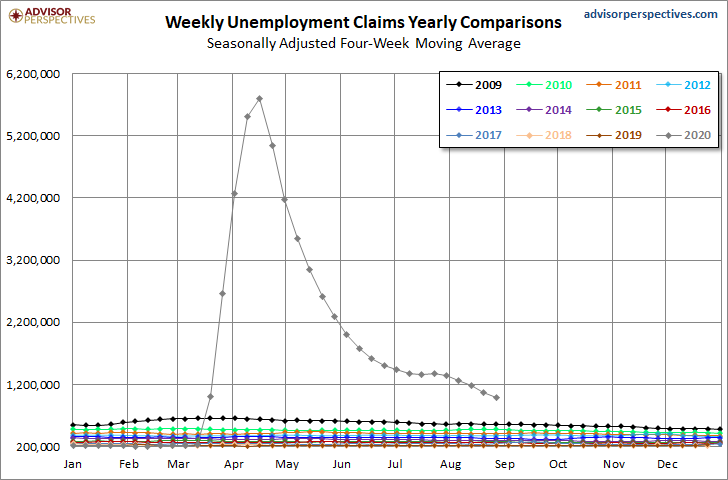
Here is a close look at the data over the decade (with a callout for the past year), which gives a clearer sense of the overall trend in relation to the last recession.
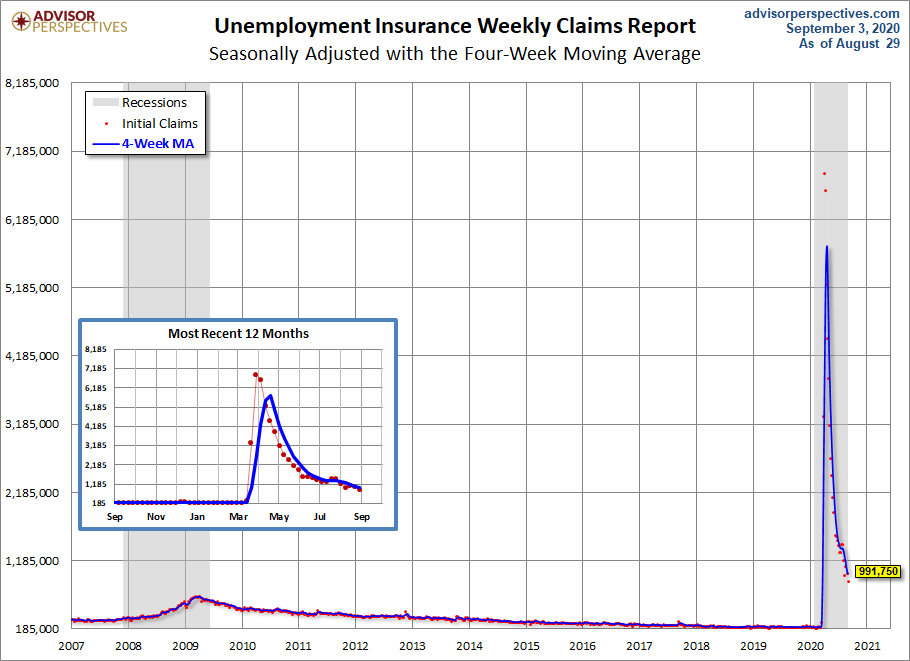
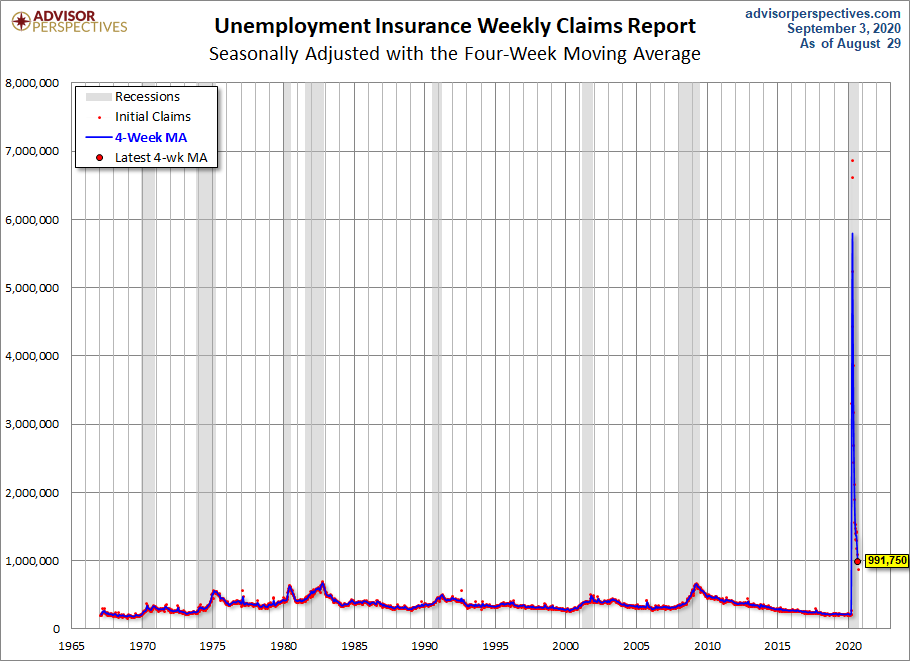
As we can see, there's a good bit of volatility in this indicator, which is why the 4-week moving average (the highlighted number) is a more useful number than the weekly data. Here is the complete data series.
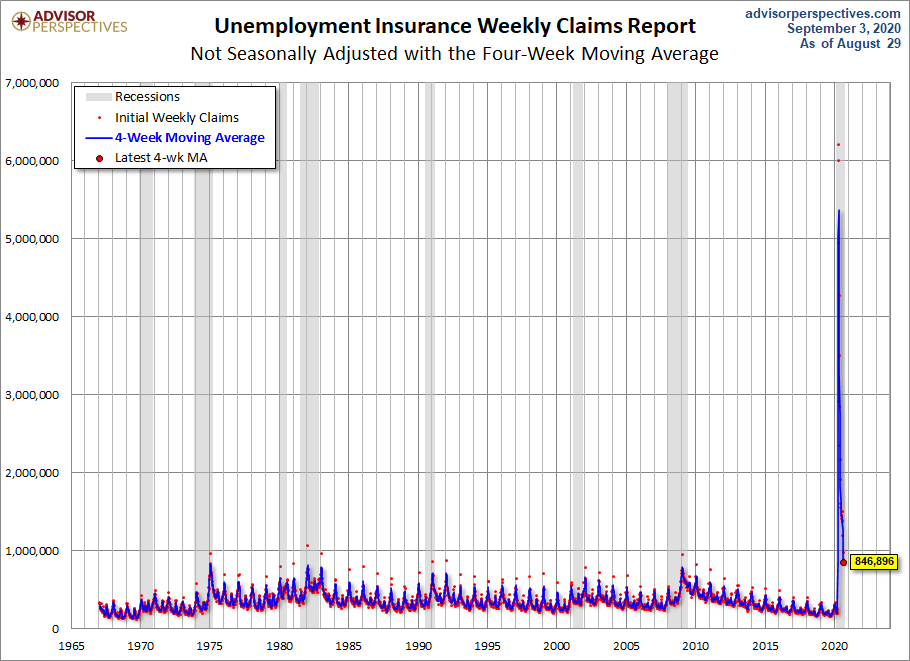
The headline Unemployment Insurance data is seasonally adjusted. What does the non-seasonally adjusted data look like? See the chart below, which clearly shows the extreme volatility of the non-adjusted data (the red dots). The 4-week MA gives an indication of the recurring pattern of seasonal change (note, for example, those regular January spikes).
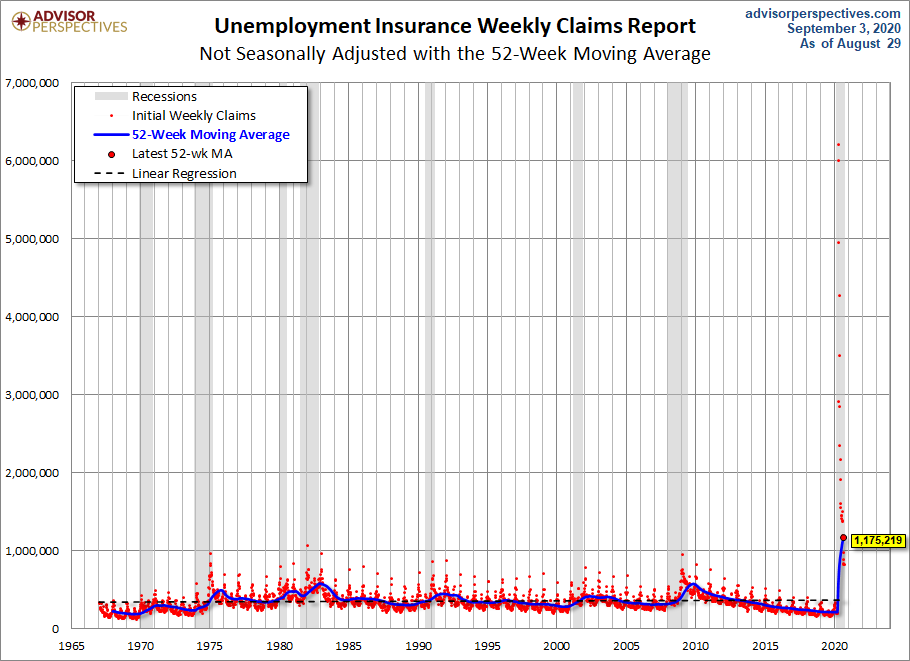
Because of the extreme volatility of the non-adjusted weekly data, we can add a 52-week moving average to give a better sense of the secular trends. The chart below also has a linear regression through the data.
Here's a look at each year's claims going back to 2009.
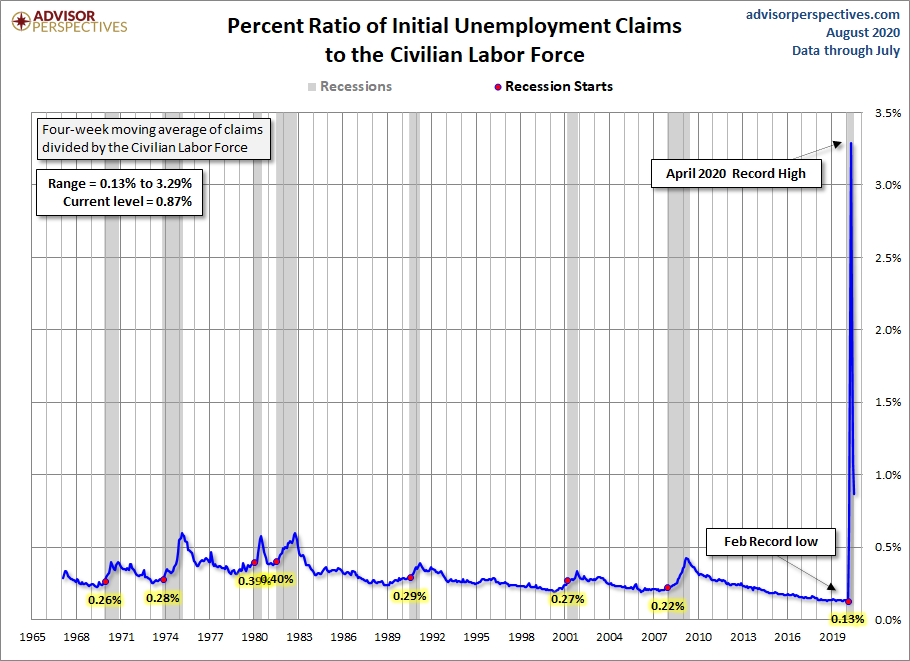
For an analysis of unemployment claims as a percent of the labor force, see this regularly updated piece The Civilian Labor Force, Unemployment Claims and the Business Cycle. Here is a snapshot from that analysis.


Comments
Log in or sign up to join the conversation.