
GBP/USD WEEKLY PRICE CHART
(Click on image to enlarge)
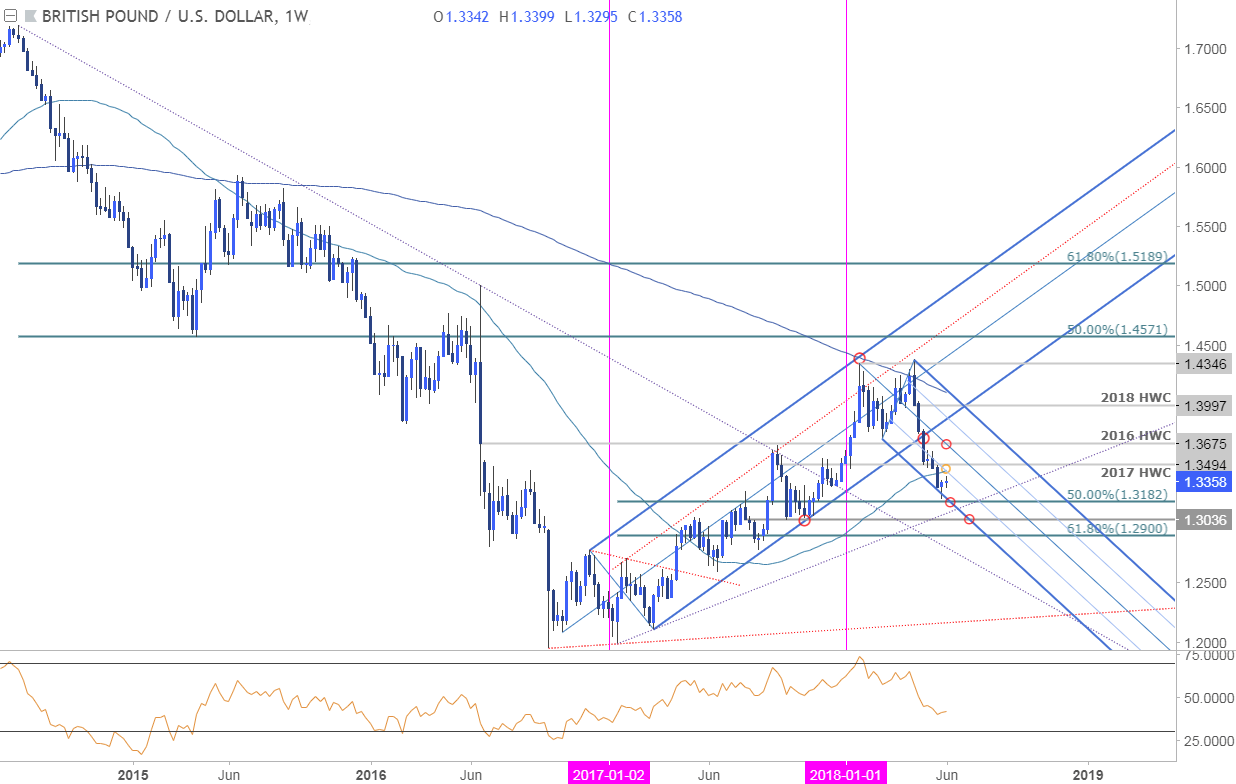
Notes: The British Pound is down more than 7% from the yearly highs with price continuing to trade within the confines of descending pitchfork formation extending off January / April highs at 1.3182 (low registered at 1.3205). Note that weekly momentum held above 40 on this sell-off and IF price Sterling is going to bounce near-term, this would be a good spot.
Confluence resistance stands at 1.3450/94 where the 2017 high-week reversal close and the 52-week moving average converge on the 50-line of the downslope. A weekly close above this threshold would be needed to suggest a more significant low is in place with such a scenario targeting the 2016 high-week reversal close (Brexit) at 1.3675.
Bottom line: Sterling is testing downtrend support and the immediate short-bias remains at risk near-term while above 1.3182. From a trading standpoint, a final washout into this region may offer an opportunity to fade a portion of this decline. That said, the broader outlook does remain weighted to the downside while within this formation and a larger correction here could offer more favorable short-entries in the weeks ahead. A break lower would invalidate the rebound play with subsequent support objectives at eyed at 1.3036 and the 61.8% retracement at the 1.29-handle. For now, the immediate focus is on a break of the 1.3182-1.3494 zone for guidance as price carves out the June opening range.
GBP/USD IG CLIENT POSITIONING
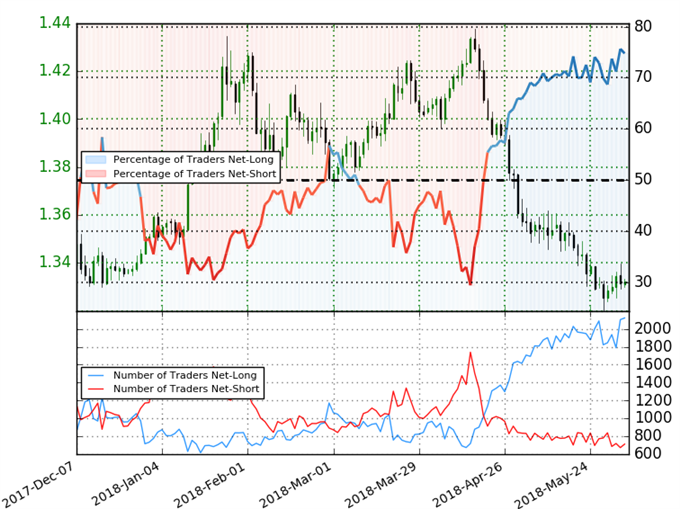
- A summary of IG Client Sentiment shows traders are net-long the British Pound (GBP/USD)- the ratio stands at +2.96 (74.8% of traders are long) – bearishreading
- Retail has remained net-long since April 20th; price has moved 6.4% lower since then
- Long positions are 14.0% higher than yesterday and 3.3% higher from last week
- Short positions are 1.8% higher than yesterday and 12.3% lower from last week
- We typically take a contrarian view to crowd sentiment, and the fact traders are net-long suggests GBP/USD prices may continue to fall. Traders are further net-long than yesterday and last week, and the combination of current positioning and recent changes gives us a stronger GBP/USD-bearish contrarian trading bias from a sentiment standpoint.


Comments
Log in or sign up to join the conversation.