

In this series we scale-back and take a look at the broader technical picture to gain a bit more perspective on where we are in trend. Here are the key levels that matter heading into the open of February trade. Review this week’s Strategy Webinar for an in-depth breakdown of these setups and more.
DXY WEEKLY PRICE CHART
(Click on image to enlarge)
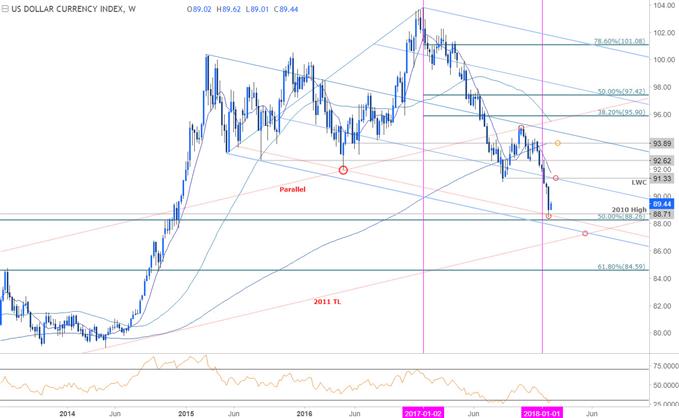
Notes: The dollar index is testing a key support range at 88.26/71 where the 2010 swing high converges on the 50% retracement of the 2011 advance. Note that basic downslope support also converges on this region and further highlights the near-term risk to the broader downtrend. That said, look for resistance back up at last year’s low-week close at 91.33 with a breach above 93.89 needed to shift the medium-term focus higher.
Bottom line: While our broader outlook remains weighted to the downside, price is now testing down-trend support and could limit further declines in the near-term. A break lower targets the 2011 trendline, currently around ~86.60s. Ultimately, from a trading standpoint, I’d be looking to fade a rally higher into the February open towards resistance.
USD/JPY WEEKLY PRICE CHART
(Click on image to enlarge)
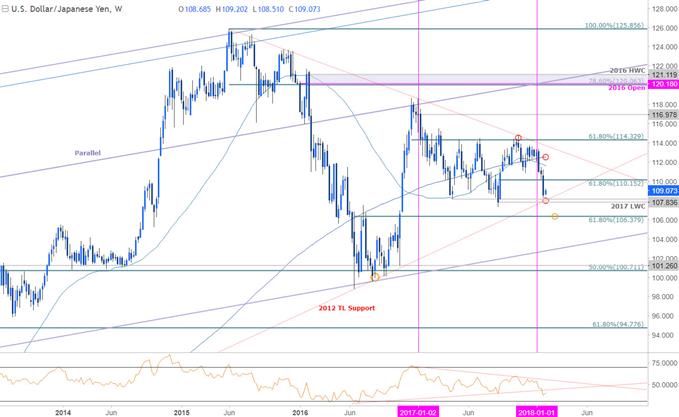
Notes: USD/JPY is approaching a technical support confluence at 107.45/84- a region defined by the April lows, the 2017 low-week close and basic trendline support extending off the late-2012 swing lows. The immediate short-bias is at risk near-term while above this threshold with interim resistance eyed at 110.16.
Bottom line:Although the broader outlook remains weighted to the downside, the decline could see a minor interruption heading into the close of the month. That said, a rebound would have us looking for short-entries while below the yearly open at 112.65 with a break below support eyeing subsequent targets at the 61.8% retracement at 106.38 backed by slope support near 102.80s.
USD/JPY IG CLIENT POSITIONING
(Click on image to enlarge)
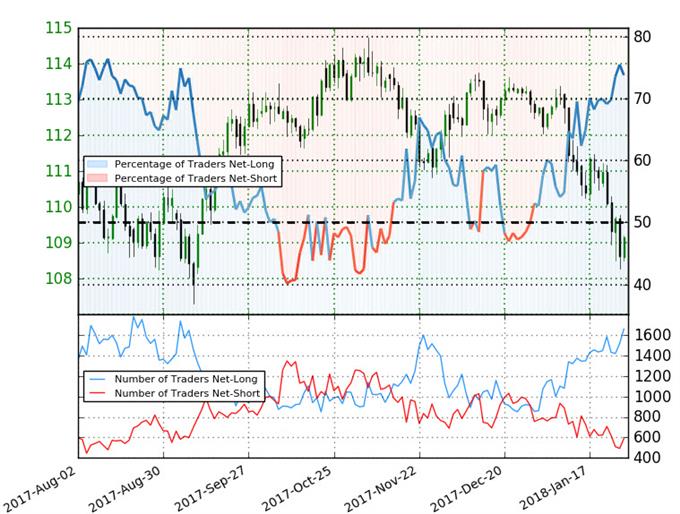
- A summary of IG Client Sentimentshows traders are net-long USD/JPY- the ratio stands at +2.82 (73.8% of traders are long) – bearishreading
- Retail has remained net-long since Dec 29th; price has moved 3.6% lower since then
- Long positions are 11.5% higher than yesterday and 9.6% higher from last week
- Short positions are 10.9% higher than yesterday and 16.8% lower from last week
- We typically take a contrarian view to crowd sentiment, and the fact traders are net-long suggests USDJPY prices may continue to fall. Traders are further net-long than yesterday and last week, and the combination of current positioning and recent changes gives us a stronger USDJPY-bearish contrarian trading bias from a sentiment standpoint.
NZD/USD WEEKLY PRICE CHART
(Click on image to enlarge)
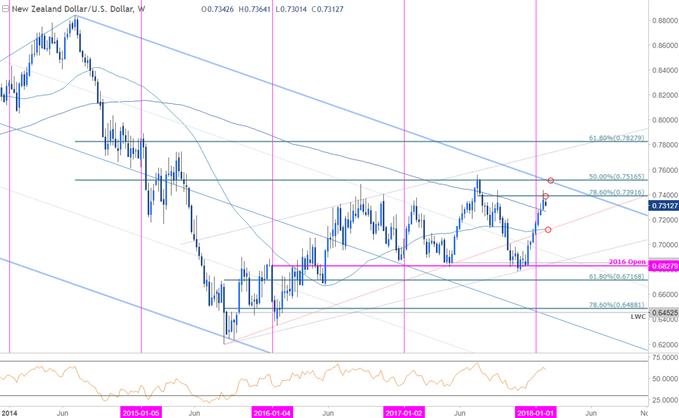
Notes: Kiwi is coming off the back of a seven-week advance with price failing to close above the 78.6% retracement of the 2017 decline at 7391 last week. I’m looking for a reaction at the long-term 200-week moving average at ~7268 with a break there needed to suggest that a more significant near-term high is in place. That said, bullish invalidation rests at the confluence of the 52-week moving average and slope support extending off the 2015 lows at 7120s.
Bottom line: The pullback is likely to be short-lived based on previous instances of seven week run-ups and a breach higher from here looks for a stretch into key resistance at 7512/17- a region defined by the 50% retracement of the 2014 decline, the 2017 high-week close and the upper median-line parallel of the broader descending pitchfork (blue). From a trading standpoint, the immediate threat may be lower but ultimately, we’ll be looking for long-entries while above the 2015 trendline (red).



Comments
Log in or sign up to join the conversation.