
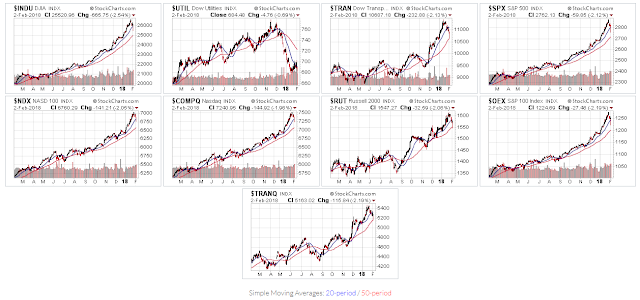
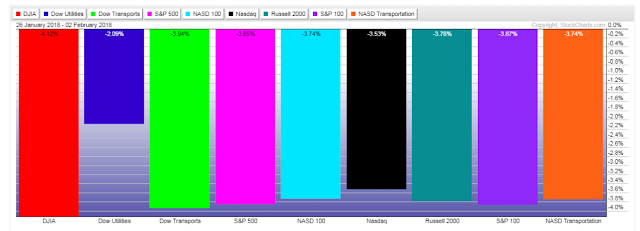
The following 1-year chart grids and 1-week gains/losses graphs show, at a glance, where a variety of major world markets are trading and how much they gained/lost this past week. They are presented without individual commentary. The charts will, however, simply show, at a glance, minor and major support/resistance levels in the form of 20 & 50-day moving averages and price swings/consolidation levels, as well as which markets are leaders or laggards in their performance during the 1-year period.
For my detailed analyses that I've completed over the past couple of weeks, especially this last week, on some of these markets, you can review them on my Blog at your leisure.
Major U.S. Indices
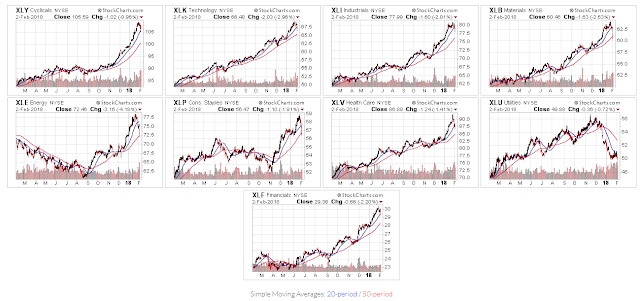
Major U.S. Sectors

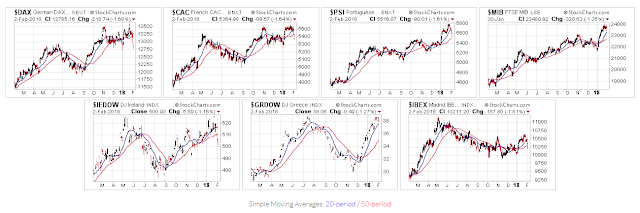
Major European Indices

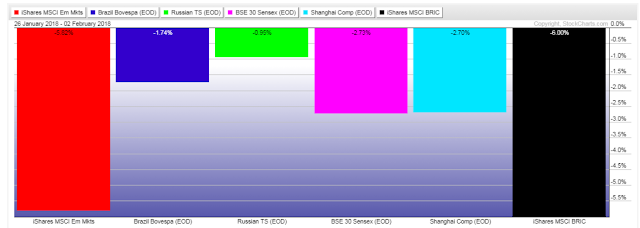
EEM & BRIC ETFs and BRICS Indices

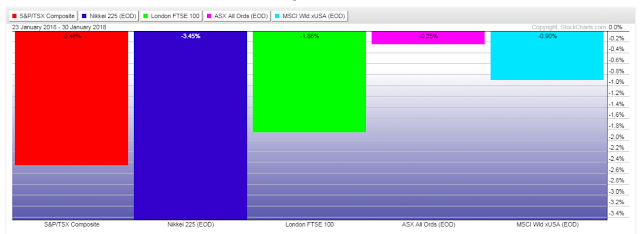
Other World Indices

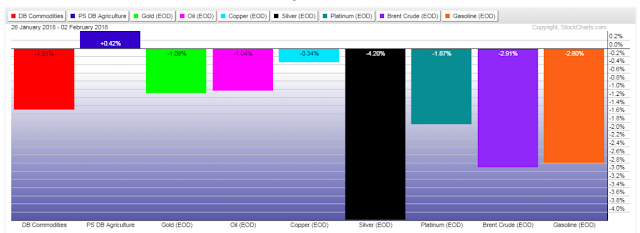
Commodities

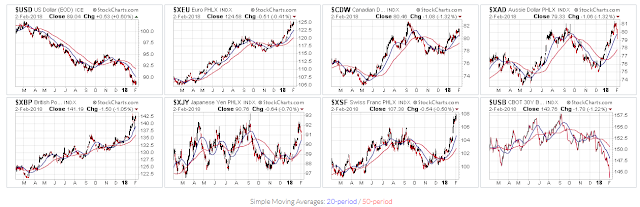
Currencies and 30-YR U.S. Bonds


Comments
Log in or sign up to join the conversation.