

Last week, volatility rose sharply across all markets as traders prepare for another big week of economic events. On Tuesday, September 29, the first US presidential election debate between Donald Trump and Joe Biden is set to take place and traders will be watching the opinion polls after very closely.
But for US markets, the risk factors do not stop there. On Friday, October 2, the US releases its latest Non-Farm Payroll and Unemployment figures in what is typically the most anticipated news event for the month. The market is expecting a fall in the unemployment rate and any surprises could add more fuel to the recent volatility.
Another round of Brexit talks is also set to resume this week, which could keep the British pound high on traders' watchlists. Amid these high impact political events, markets are also dealing with the second wave of coronavirus which is spreading throughout Europe and has helped traders flock to the US dollar.

Source: Forex Calendar provided by Admiral Markets UK Ltd.
Key economic reports and markets to watch
Trump vs Biden Presidential Debate Tuesday
The first US presidential election debate is set to take place this week in Cleveland, Ohio. There are three presidential debates overall with the next one on 15 October in Miami, Florida and the last one on 22 October in Nashville, Tennessee. They all take place 02:00 - 03:30 GMT (21:00 - 22:30 ET).
Election debates can have a huge impact on financial markets as the candidates are on their own and do not have the support of their campaign staff. The format for the first debate is for the candidates to answer six questions across six segments with fifteen minutes each. This includes the candidates' previous records, the Supreme Court nomination, the coronavirus pandemic, race protests, election integrity and the economy.
US Non-Farm Payroll Friday
On Friday, the Bureau of Labor Statistics in the US will release the following economic figures at 1.30 pm BST:
- Average Hourly Earnings
- Non-Farm Employment Change
- Unemployment Rate
The market is expecting a rise in Non-Farm payrolls which is expected to drop the unemployment rate from 8.4% previously to 8.3%. The US dollar has been the worst-performing currency in recent months but has roared back to life in the past few weeks and now becoming the best performing currency.
However, a lot of this move could be down to the fact coronavirus infections are rising rapidly in Europe while falling in the US. One trend that has developed - albeit not consistently - is that investors shun economies with rising coronavirus cases due to the impact it can have on economic growth. This week's figures from US news announcements are setting up to be extremely important.
(Click on image to enlarge
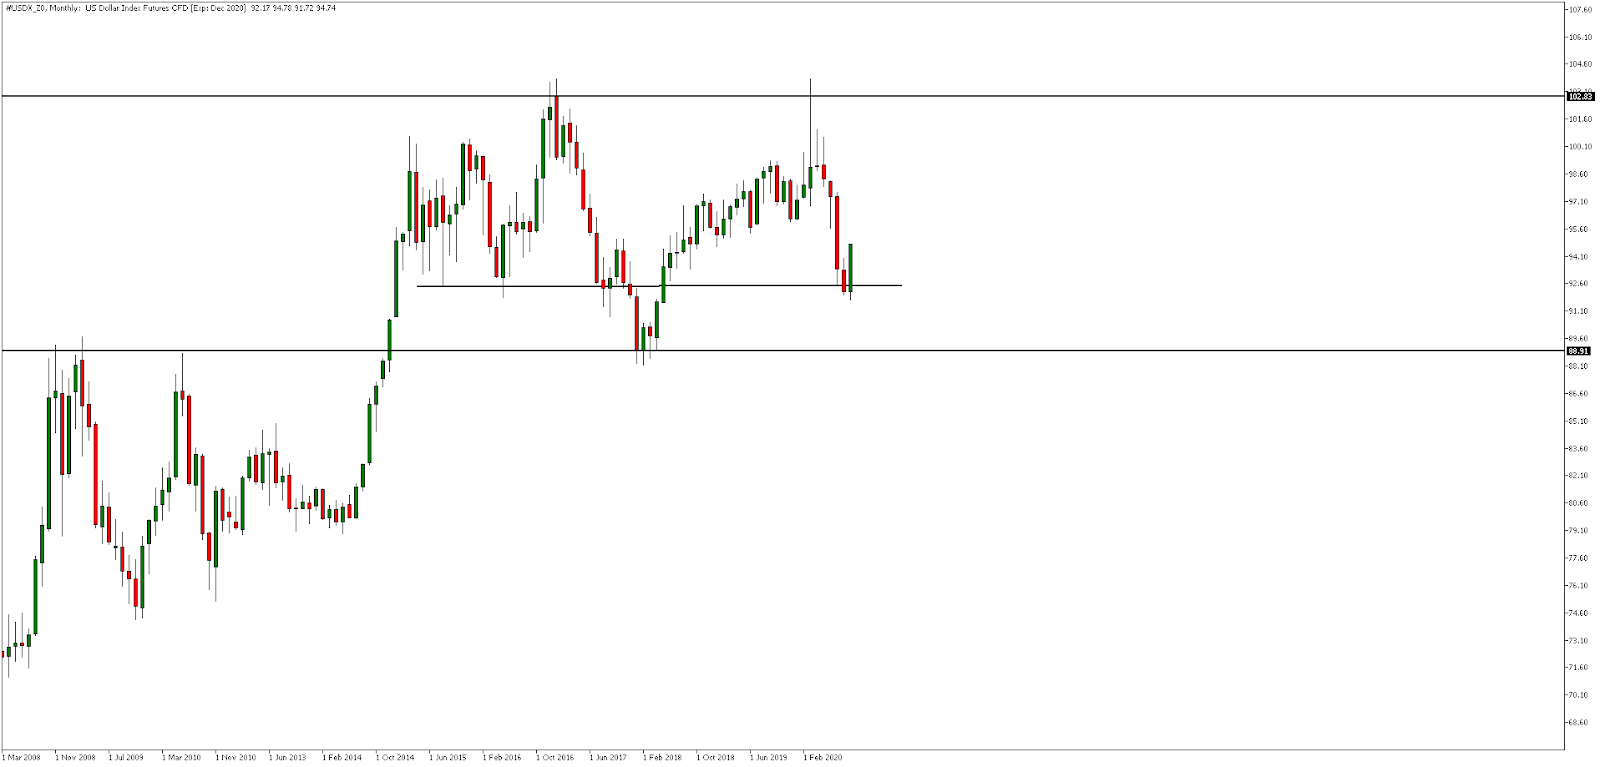
Source: Admiral Markets MetaTrader 5, #USDX_X0, Monthly - Data range: from March 1, 2008, to September 25, 2020, performed on September 25, 2020, at 6.00 pm BST. Please note: Past performance is not a reliable indicator of future results.
In the long-term monthly chart above of the US dollar index, it's clear to see the rejection of intermediate support in the middle of the larger trading range between 102.83 and 88.91 (upper and lower black horizontal lines). The rejection of support at around 92.60 in the middle of this trading range is also in between the 61.8% and 78.6% Fibonacci retracement level from the lower horizontal support line to the upper horizontal resistance line.
Traders will be looking for positive economic announcements to support a bounce from this support area and continue its push higher. Strength in the US dollar may not bode well for EURUSD and GBPUSD as both Europe and the UK are struggling with a second wave of the coronavirus. It's unclear how the US presidential election debate will unfold and its impact on the US dollar but time will tell!
Corporate trading updates and stock indices
Last week, most global stock market indices recorded their fourth straight week of losses. However, most of the losses have been driven by mega-cap technology stocks which have a heavy weighting in stock market indexes. The sell-off may provide an opportunity for 'dip-buyers' but there are still associated risks.
House Democrats are due to table a $2.4 trillion relief package that could be voted on this week. But the size of the package is considerably above what Republican leaders are willing to approve. If a deal can be made, it may just attract more dip-buyers into the market but a lot will also hang on the outcome of the US presidential election debate this week.
(Click on image to enlarge)
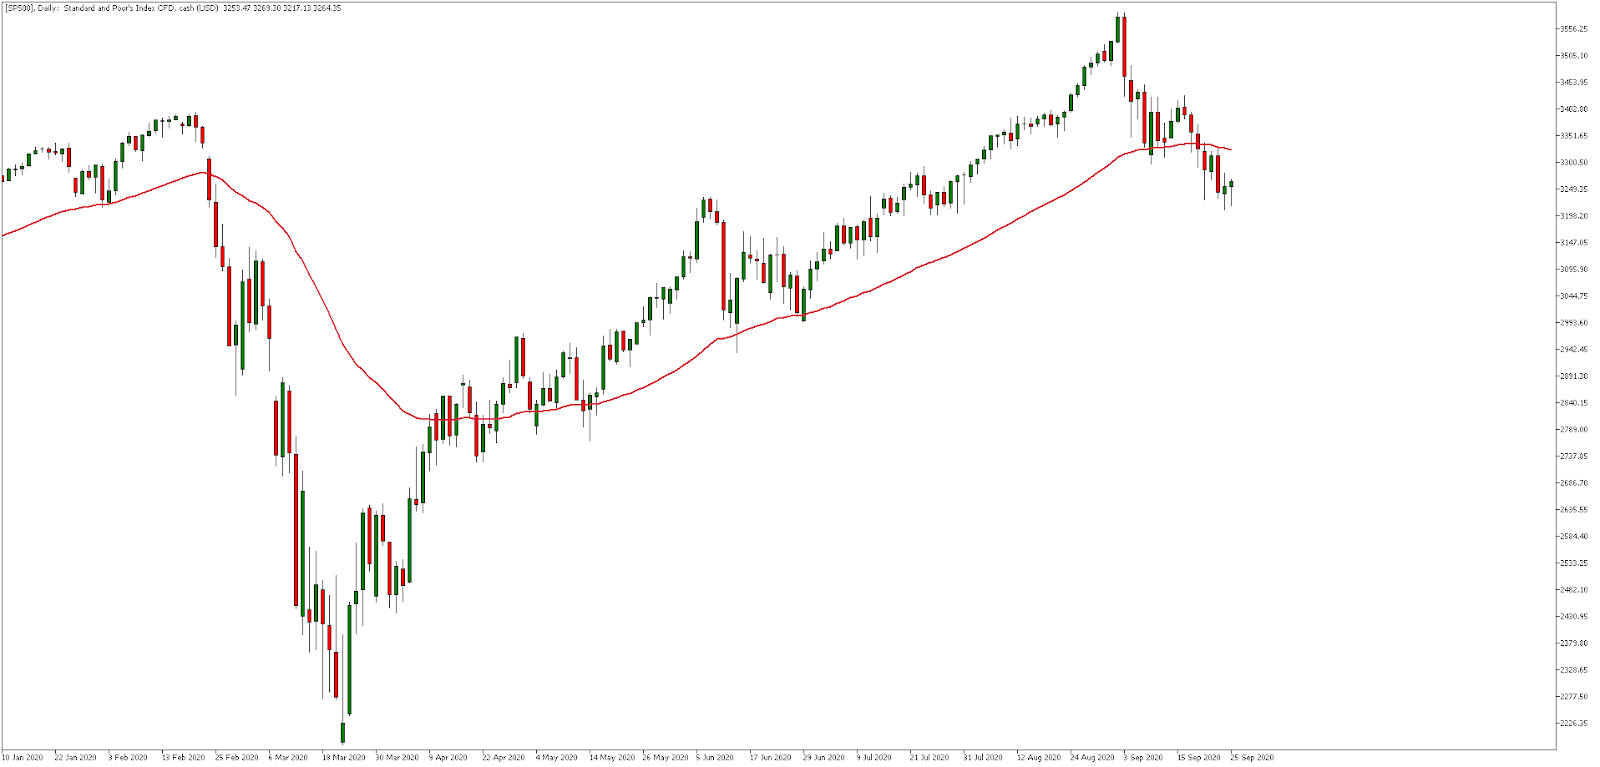
Source: Admiral Markets MetaTrader 5, SP500, Daily chart- Data range: from January 10, 2020, to September 25, 2020, performed on September 25, 2020, at 7.30 pm BST. Please note: Past performance is not a reliable indicator of future results.
Last five-year performance: 2019 = +29.09%, 2018 = -5.96%, 2017 = +19.08%, 2016 = +8.80%, 2015 = -0.82%, 2014 = +12.32%
In the daily chart of the S&P 500 index shown above, the price has managed to break through the 50-exponential moving average as shown by the red wavy line on the chart. Since the price crossed above the moving average in April, buyers have remained in control. Therefore, it will be interesting to see if buyers can manage to get back above the moving average after all the high impact news announcements this week.



Comments
Log in or sign up to join the conversation.