
The first full week of October is setting up to be a big one with major economic announcements from central banks around the world. The markets may have already digested the following:
- The outcome of the first US presidential election debate last week
- US President Donald Trump testing positive for the coronavirus
- Ongoing Brexit uncertainty last week and may now turn to economic data.
First up on the calendar is Tuesday's Reserve Bank of Australia Rate Statement. No changes are expected and the futures interest rate market is not pricing in any type of rate cut. However, there is scope for the bank to move to 0.1% from the current record low of 0.25%. Most other G7 nations are already around the 0.1% level so it's a report to watch.
On Wednesday at 7 pm BST all eyes will be on the latest meeting minutes released from the US Federal Open Market Committee (FOMC). It's unlikely that the meeting minutes release will show anything different from the last meeting so close to the US Presidential election in November.
A common theme among many central bankers is that more fiscal stimulus is needed which may cause the bank to wait until Democrats and Republicans can reach an agreement on the next round of economic stimulus, which is currently deadlocked.
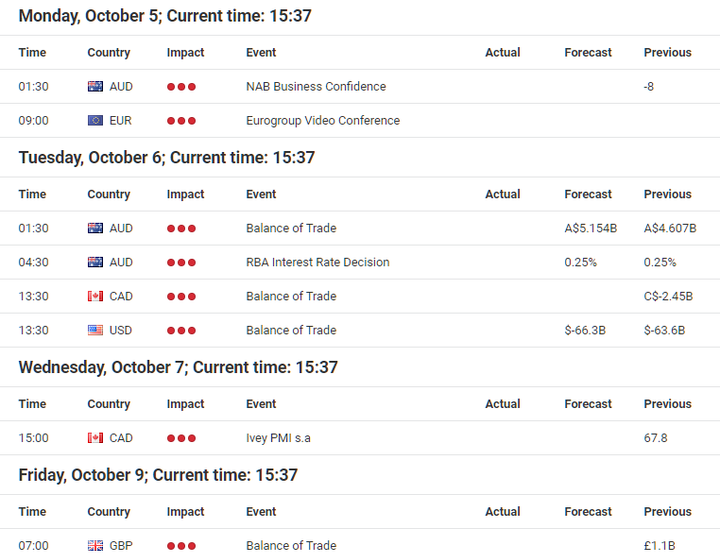
Source: Forex Calendar provided by Admiral Markets UK Ltd.
While traders will be focusing on the upcoming news announcements this week, there is still an ongoing focus on bigger themes in the market right now which include:
- The US presidential election and whether Trump will accept the result or not
- Brexit talks where an agreement needs to be reached by 15 October
- The impact of a possible second wave of the coronavirus.
Preparation is absolutely key in navigating such conditions.
Key economic reports and markets to watch
Reserve Bank of Australia Rate Statement
It's a big week for the Australian dollar as a raft of different economic news announcements is set to stream across traders' desks this week. This includes:
- Tuesday 6 October 4.30 am BST
- RBA Rate Statement
- RBA Cash Rate
- Annual Budget Release (tentative)
- Friday 9 October 1.30 am BST
- RBA Financial Stability Review
No changes are expected from the current rate and policy measures set by the Reserve Bank of Australia. However, only recently the RBA's Deputy Governor, Guy Debelle, painted a very bleak picture of the Australian economy in a speech. While the interest rate futures market is not pricing in any changes there could always be that element of surprise.
The RBA certainly has room to breathe with current rates set at 0.25%. Most other central banks have been quick to cut with the European Central Bank at 0% and the Bank of England at 0.1%. Australian bank Westpac recently created a stir in the markets with a forecast of a rate cut this week before changing the outlook to a November rate cut.
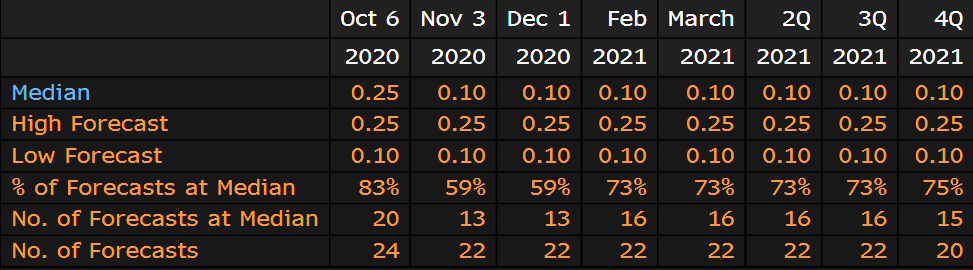
However, it seems the markets are pricing in some type of rate cut in the future with a Bloomberg survey citing a median forecast of a 0.1% interest rate at the November meeting with a 59% probability from those surveyed, as shown below. What's more interesting is that the percentage of median forecasts surge to 73% from February 2021.
(Click on image to enlarge)
If the RBA should surprise the market then there is the risk of a potential sell-off in the Australian dollar. In fact, the AUDUSD currency pair has only recently broken the long-term uptrend from the March lows, as shown in the daily chart below:
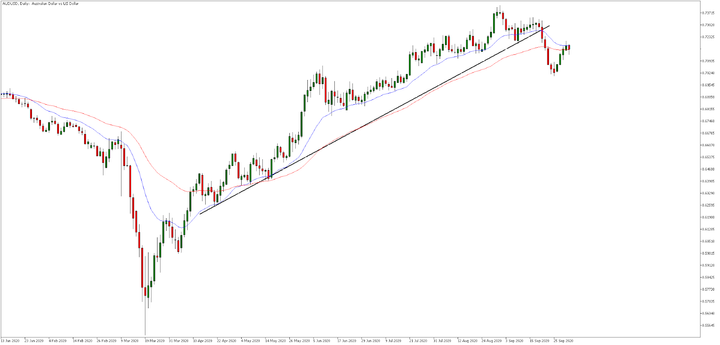
Source: Admiral Markets MetaTrader 5, AUDUSD, Daily - Data range: from Jan 13, 2020, to Oct 5, 2020, performed on Oct 5, 2020, at 6.00 am BST. Please note: Past performance is not a reliable indicator of future results.
Last five-year performance: 2019 = -0.48%, 2018 = -9.67%, 2017 = +8.38%, 2016 = -1.26%, 2015 = -10.64%, 2014 = -8.57%
The long-term trend line shown by the ascending black line in the chart above has been broken, suggesting the appetite of buyers has waned. Price action is also trading below the 20 and 50-period exponential moving average. Much will depend on the US dollar as well but if the market rejects the recent lows, it may be an early warning sign of weakness closer to the November meeting, unless there is a surprise this week.
Corporate trading updates and stock indices
After four weeks of consecutive losses, US stock market indices finally managed to record a positive week, albeit not by much. The Nasdaq 100 stock market index led the way as traders and investors look for growth in big-name technology stocks. However, it was an up and down week for intraday traders due to the volatility of the US presidential election debate and the news of US President Donald Trump testing positive for the coronavirus.
European stock market indices continue to lag behind their American counterparts. However, Germany's DAX 30 and France's CAC 40 did manage to end the week in the positive but by a very small margin. Fears of a second wave of a coronavirus have subdued investors' appetite, as well as the high euro which has been favored among many long-term asset managers due to its stability relative to the US dollar.
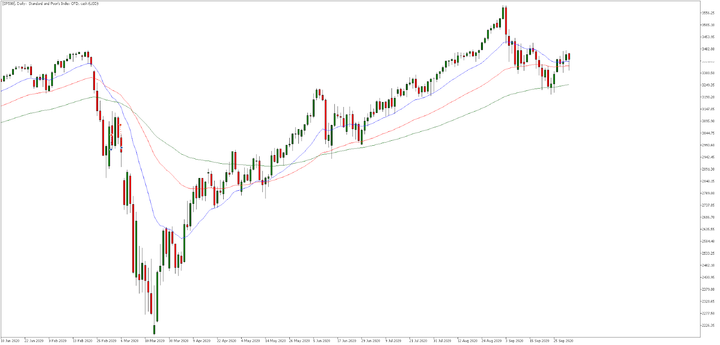
Source: Admiral Markets MetaTrader 5, SP500, Daily - Data range: from January 10, 2020, to October 5, 2020, performed on October 5, 2020, at 7.30 am BST. Please note: Past performance is not a reliable indicator of future results.
Last five-year performance: 2019 = +29.09%, 2018 = -5.96%, 2017 = +19.08%, 2016 = +8.80%, 2015 = -0.82%, 2014 = +12.32%
In the daily chart of the S&P 500 stock market index shown above, the price has most recently bounced off the 100-period exponential moving average (green line). This level of technical support is perhaps just one reason why the week ended positively as longer-term value buyers may have started to initiate fresh long positions.
Traders will be looking for buyers to continue this momentum but a break back below the low around the 100 EMA, could open the doorway to another round of selling. But for now, it seems like the bulls are in control but this would be more confirmed on a break of the previous cycle high above the 3,460.00 level.


Comments
Log in or sign up to join the conversation.