
With summer holidays coming to an end volatility has dramatically increased as traders now eye up the run-up to the end of the year. While the big themes of a resurgent coronavirus, the US presidential election and Brexit talks still take precedent there are some additional key news announcements to know about this week.
Both the Bank of Canada (BOC) and the European Central Bank (ECB) release their latest monetary policy statements and interest rate decision this week on Wednesday and Thursday respectively. No changes are expected from either central bank but all eyes will be on ECB President Christine Lagarde and her response to recent comments from other ECB members highlighting the concern of the higher euro.
Brexit talks are also set to resume this week in what is deemed a crucial round that will impact the potential of a deal in October. This is now the eighth round of talks and so far very little progress has been made with major issues still yet to be resolved, such as how to establish a level playing field, workers' protections and fishing rights. Fortunately, the British pound has been supported in recent weeks by better economic data.
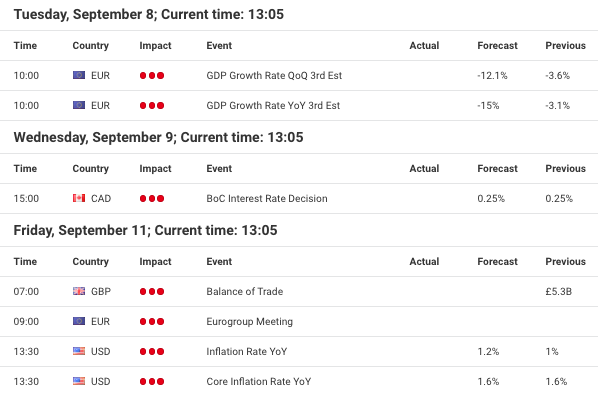
Source: Forex Calendar provided by Admiral Markets UK Ltd.
Global stock markets have taken an interesting turn after the S&P 500 snapped a five-week winning streak, along with most other global stock indices turning lower for the week. The sharp sell-off last week caused the Dow Jones 30 to fall around 1,000 points lower in moves not seen since June. The stock market rally has raised eyebrows regarding the excessive valuations for some companies and has led some to suggest a correction is long overdue.
Key economic reports and markets to watch
Bank of Canada Rate Statement
On Wednesday at 3.00 pm BST, the Bank of Canada is set to release the latest BOC Rate Statement. No changes are expected at this time as recent economic data from Canada has shown its recovery is gaining momentum thanks to the government's fiscal response and the bank's monetary response. This has helped to lift employment and GDP.
However, the bank has been known to surprise the market and there is still room to maneuver from its current 0.25% interest rate. The bank's monetary policy guidelines are due for renewal in 2021, fuelling speculation of changes in the way they target inflation. For now, traders will be most interested in how the bank views the progress of the recent recovery.
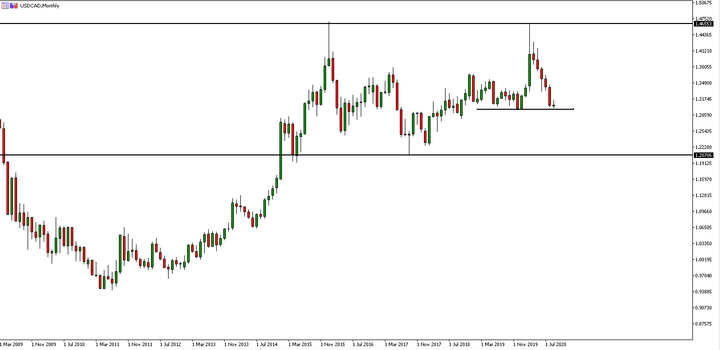
Source: Admiral Markets MetaTrader 5, USDCAD, Monthly - Data range: from March 1, 2009, to September 7, 2020, performed on September 7, 2020, at 6.00 am BST. Please note: Past performance is not a reliable indicator of future results.
In the long-term monthly price chart above, USDCAD has traded in a range between the 1.4655 and 1.2070 price level. After the recent rejection of the upper horizontal resistance line, the exchange rate has fallen to an intermediate support level around 1.3000, as highlighted by the middle line on the chart. If sellers can break through this support level, traders will be eyeing the lower horizontal support line at 1.2070 once again.
European Central Bank Press Conference
The European Central Bank is set to release its Main Refinancing Rate figure and Monetary Policy Statement at 12.45 pm BST on Thursday. Shortly after at 1.30 pm BST, the ECB Press Conference is due to take place. No changes are expected but as the Eurozone economy has started to slow ECB members have expressed concern regarding the recent appreciation of the euro.
It is this that traders will be most interested in learning more about. A higher euro affects economic growth for the bloc. But, has it appreciated high enough for the bank to intervene? The recent combination of an improving Eurozone economy and a worsening US economy has helped EURUSD to surge higher. Many fund managers are also seeing the euro as a more stable currency to invest in over the upcoming US presidential election. Thus, it is a problematic scenario for the bank.
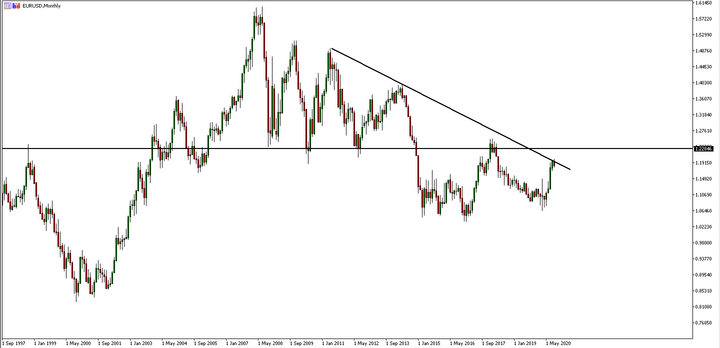
Source: Admiral Markets MetaTrader 5, EURUSD, Monthly - Data range: from September 1, 1997, to September 7, 2020, performed on September 7, 2020, at 7.00 am BST. Please note: Past performance is not a reliable indicator of future results.
The recent rally higher in the EURUSD has been impressive with four bullish monthly candles. Price is now at an interesting zonal area of resistance in-between a descending trend line but with a stronger horizontal resistance line further up at 1.2284. A more dovish tone from the central bank could attract sellers at these key resistance levels. If ECB President Christine Lagarde shrugs off the recent appreciation, it may attract more institutional flows, leading price to break through the descending trend line and moving further up to the 1.2284 level.
Corporate trading updates and stock indices
Global stock markets struggled last week in a dramatic surge in volatility. The sharp sell-off led to losses in high-flying tech shares like Amazon and Facebook with the Nasdaq 100 stock index down more than 5% during one session. While many analysts have been calling for a long-overdue correction, the volatility last week was tied to outsized options trade from just one firm.
According to the Financial Times, Japan's SoftBank purchased billions of dollars in tech derivatives in the past month which drove up volumes and volatility. The unusual activity helped to explain why the Volatility Index (VIX) - otherwise known as Wall Street's 'fear gauge' - was rising while stock prices were also rising.
Now, both traders and investors are questioning whether this sell-off is the start of something bigger. Many analysts point to the fact the recent rally higher has forced excessive valuations in some companies that will correct at some point. However, there has been a big divergence between US stocks and European stocks with the latter lagging behind. This is most likely due to the higher euro, while US stocks may have benefitted in part by a weakening US dollar.
While the S&P 500 and Nasdaq 100 index have traded at new all-time highs, European indices have struggled as the chart of the DAX 30 stock index shows below:
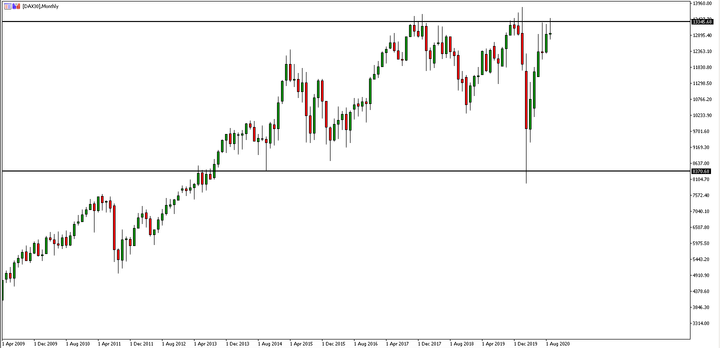
Source: Admiral Markets MetaTrader 5, DAX30, Monthly - Data range: from April 1, 2009, to September 7, 2020, performed on September 7 2020, at 6.30 am BST. Please note: Past performance is not a reliable indicator of future results.
In the long-term monthly price chart above, the recent rally higher in the DAX 30 index from its March lows has been impressive. However, recent price action shows buyers have been struggling to justify valuations above the 13400 to 13800 price level. The messaging from the ECB and the direction of the euro is likely to have an impact on what the next move could be for the DAX 30 and whether price can break to new all-time high price levels or not.
All in all, it is setting up to be another interesting week in the financial markets.


Comments
Log in or sign up to join the conversation.