

Summary
- Primary Dealers started accumulating long dated Treasuries, as central banks grab long-duration paper. The Modeled Buying Behavior of Central Banks suggest the inflection point lower in yields is nigh.
- Alan Longbon's primer on bank reserve management: the Fed's objective is to issue just as many reserves that are required for the law and to meet the banks’ own desires.
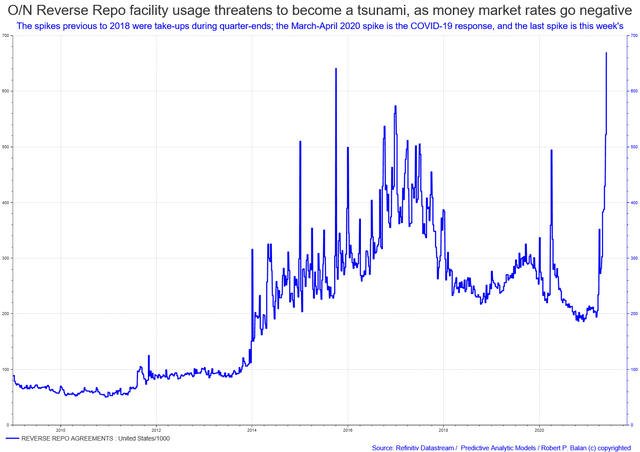
- Next market cliff-hanger: Treasury reduces the TCB from $1.6Trillion today to less than $500Billion by end June 2021; the Fed will likely use the Reverse Repo to sop up liquidty.
- Come March 31, US Treasuries will again be part of the SLR calculations, and banks have to lay out buffers for those securities (however small). The banks are not happy that the "holiday" on US Treasuries will not be renewed. Hence there was this move into T-Bills (which require smaller buffers, as bills are almost "cash"). Bill rates fell (due to demand, and small supply) while long bond yield rose (relatively plentiful supply). That is why bill rates plunged, and long date yields rose. And the yield curved steepened.
- The US Treasury announced that will also issue less debt starting in Q2 2021. During the April – June 2021 quarter, Treasury expects to borrow "only" $95 billion in marketable debt. The Q2 borrowing forecast of $95 billion compares to $600 billion of debt issuance in the prior quarter (Q1 2021) and a total of $4.3 trillion for 2020. That is largely due to the TCB drawdown which will soon take place. As NEW TCB and Bank Reserves, including NEW SOMA transactions (the process in which the Fed monetizes the debt issued by the Treasury) are created only by NEW debt issuance, it is not difficult to visualize that these major systemic liquidity spigots will be spewing much less "NEW money" in H2 2021 relative to Q1 2021. The liquidity drought which just started will be extended for at least another quarter -- that will have a lot of negative impact on risk assets.
WEEKEND MUSINGS -- FEBRUARY 21 & 22, 2021
robert.p.balanModeratorLeaderOwnerFeb 20, 2021 10:12 AM
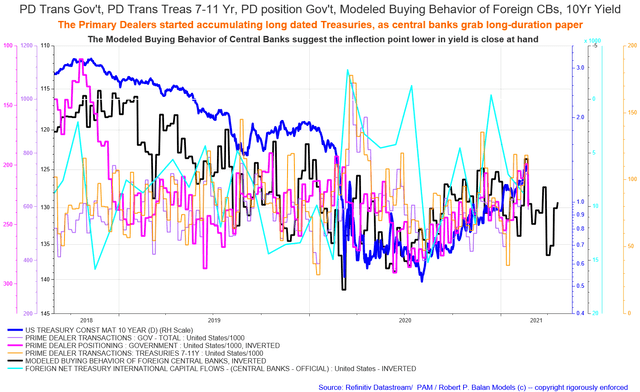
The Primary Dealers started accumulating long dated Treasuries, as central banks grab long-duration paper.
The Modeled Buying Behavior of Central Banks suggest the inflection point lower in yield is close at hand.
bogeygolfFeb 20, 2021 8:41 AM
this is fantastic research!
RM13Feb 21, 2021 6:34 AM
Agree, this is great..
robert.p.balanModeratorLeaderOwnerFeb 20, 2021 10:12 AM
Thanks bogeygolf, Rafa
gwizz1Feb 20, 2021 12:00 PM
a) Why does less foreign central bank buying lead to lower yields?
b) Will primary dealer purchases of bonds lead futures/lower yields with a bit of a delay [until CTA shorts are exhausted]?
bogeygolfFeb 20, 2021 7:17 PM
may not be CTA's selling bonds last week, could be "MBS convexity hedging"
robert.p.balanModeratorLeaderOwnerFeb 20, 2021 12:18 PM
(A) Rising yield means cheaper prices, as CBs buy the amount of long dated paper diminishes -- price increases (yield falls).
(B) the MOTUs front run the bond market, even the central banks -- they know, so why not buy ahead of everyone (increasing positions taken).
gwizz1Feb 20, 2021 1:09 PM
Sorry Robert, I didn't ask (A) clearly: the chart showed modeled buying behavior of central banks decreasing into 2021 - therefore why would yields fall / bond prices increase from this contributor?
robert.p.balanModeratorLeaderOwnerFeb 20, 2021 1:10 PM
GW -- the serie is inverted in the chart -- I forgot to put that in the label -- but the Y scale show it is inverted
Alan.LongbonFeb 20, 2021 12:32 PM
Here are some recent wise words from Prof Mitchell on the Central Bank and its management of reserves.
The facts are as follows. First, central banks will always provide enough reserve balances to the commercial banks at a price it sets using a combination of overdraft/discounting facilities and open market operations.
Second, if the central bank didn’t provide the reserves necessary to match the growth in deposits in the commercial banking system then the payments system could be impaired and there would be significant hikes in the interbank rate of interest and a wedge between it and the policy (target) rate – meaning the central bank’s policy stance becomes compromised.
Third, any reserve requirements within this context while legally enforceable (via fines etc) do not constrain the commercial bank credit creation capacity. Central bank reserves (the accounts the commercial banks keep with the central bank) are not used to make loans. They only function to facilitate the payments system (apart from satisfying any reserve requirements that might be in place).
Fourth, banks make loans to credit-worthy borrowers and these loans create deposits. If the commercial bank in question is unable to get the reserves necessary to meet the clearing requirements from other sources (other banks etc) then the central bank has to provide them. But the process of gaining the necessary reserves is a separate and subsequent bank operation to that involved in the deposit creation (via the loan).
Fifth, if there were too many reserves in the system (relative to the banks’ desired levels to facilitate the payments system and the required reserves then competition in the interbank (overnight) market would drive the interest rate down. This competition would be driven by banks holding surplus reserves (to their requirements) trying to lend them overnight. The opposite would happen if there were too few reserves supplied by the central bank. Then the chase for overnight funds would drive rates up.
In both cases the central bank would lose control of its current policy rate as the divergence between it and the interbank rate widened. This divergence can snake between the rate that the central bank pays on excess reserves (this rate varies between countries and overtime but before the crisis was zero in Japan and the US) and the penalty rate that the central bank seeks for providing the commercial banks access to the overdraft/discount facility.
So the aim of the central bank is to issue just as many reserves that are required for the law and to meet the banks’ own desires.
There are notes of my own taken from past discussions:
So if the Fed refuses, for whatever reason, to do its job of selling bonds to drain reserves, and at the same time the Fedgov does a big stimulus spend and so the reserves stay in the system and become excess reserves, then rates fall as interbank competition become less and could fall to zero if there is no support rate (IOER and IOR, which there is). So we see falling rates and bank reserves rise. Rates fall toward the bottom of the target rate and in an extreme situation fall as far as the support rate. I think we know that rising bank reserves push the SPX up.
It goes like this, money goes into the economy from somewhere (bank credit creation, Fedgov spending, foreign investment) bank reserves rise and banks have excess reserves. Equities rise as banks invest the excess reserves in paper assets, people bail out of bonds and into equities and so the rates rise as the face value of the bond falls as it is dumped in favour of other assets types. It is not that the 10yr pushes up stocks it is more a knock on effect from the injection of more money into the economy stocks up - bonds down - rates up. It is all about aggregate system liquidity.
Another take is this: Bank reserves are removed from the system via bond sales or taxes. Bank reserves become scarcer in the interbank market and therefore this drives up the interest rate as banks compete for the less abundant bank reserves to meet their daily reserve requirements. Seeing rates rising and bond prices falling, investors move out of bonds and into other assets, such as equities, thus accentuating the fall in the price of bonds and conversely the rise in the price of stocks.
The last 3 paras are taken from my notes.
gwizz1Feb 20, 2021 1:25 PM
Would it be reasonable to assume then as bank reserves rise (not drained away by issuance) / aggregate system liquidity floods and the short end is near zero or negative - i) cheap long dated bonds are bought, ii) bond prices go up / yields go down and iii) equities go up, then iv) as bonds now have been bought yields driven down so v) equities go up more?
Alan.LongbonFeb 20, 2021 1:42 PM
Yes but there are lags involved. Initially as the TCB goes down so do rates and equities follow as presumably investors move out of equities and into bonds to get the capital gain on the bonds. Then move out of bonds and back into equities to get the (NOW) higher yield and capital gain as they pendulum back up as their yield falls and face value rise.
Soma and TCB increases are positive for equities.
Simply put -- NEGATIVE for equities in the short term. But SOMA and TCB are POSITIVE for equities beyond the period of 45 trading days -- that's when the new money supply created from new loans/deposits created by the increased SOMA and TCB levels, impacts the financial markets and the general economy. And vice versa.
gwizz1Feb 20, 2021 1:43 PM
Very interesting - complex system. Thanks.
Alan.LongbonFeb 20, 2021 1:45 PM
It makes your head ache a bit imaging all the working parts and relationships. What makes it interesting is that the Fed has put the market on notice that it is not going to do its job, it plans to not issue any more debt in the near future which means it will lose control of its FFR. This might dawn on them soon and they will walk back their silliness.
paradigmFeb 21, 2021 5:32 PM
Alan.... by saying "the Fed has put the market on notice that it is not going to do its job, it plans to not issue any more debt in the near future which means it will lose control of its FFR" , do you mean that the Fed will not sell bonds off its balance sheet to the Primary Dealers?
robert.p.balanModeratorLeaderOwnerFeb 21, 2021 4:28 PM
*The next market cliff-hanger: US Treasury will reduce the TCB from $1.6Trillion today to less than $500Billion by end of June 2021*
TCB outflows to the RRP facility will tighten systemic liquidity and will undercut equities and push long-term yields lower.
Reverse Repo is a natural sink for the TCB -- it is frequently used as, and is, a natural if needed in a big way, as sopping up more than $1trillion flows from the TCB in less than 4 months.
TCB outflows to the RRP facility will tighten systemic liquidity and will undercut equities and push long-term yields lower, even much lower, if money (TERM) market rates go below zero, during the process.
The negative response of the long bond yield trails that process by one month, as does the equity markets -- but term (money) market rates will respond immediately. That's the usual lead of short term rates over the long bond
yield.

jadejetFeb 20, 2021 4:59 PM
Here is a very rare pattern formation from the market top over a 4 day period which I will call a double twin bearish reverse island formation. Please note at how identical the first day matches the fourth daily price formation and how identical the second and third day daily price formations are identical.
As I mentioned earlier Monday represents the first Monday of last year when markets initially tanked 500pts the first day. So I back-checked the same 4 days from last year's top to hopefully find a co-relation. The only co-relation I see relates to this: Both time periods were marked by three down days followed by one slightly up day. Then the earlier formation tanked down 500pts in one day, 1,500pts in a week and 3,175 pts in 20 trading days from a top of market at that time of 9,850 which is far lower than the recent top 4 days ago of 14,150.
Does the current market warrant such a lofty level of 4,300 pts gain (44%) in light of this plandemic thing not necessarily being over as variants have formed. Are we really going back to normal soon? All those hard-working entrepreneurs who spent years of hard work to build their business wiped out for good leaving only the big corporation like facecrap(Suckerberg App), twitjunk, Alphanuts, Amanass, and the like to claim bigger pieces of the pie as they pay out starvation wages.
Then we have the correction in gold which may be signaling what lies ahead for markets especially producer prices which have been trounced. Then we have overpriced oil which just recently appears to have topped at pre-plandemic prices over $60 to under $60. And what do you think will happen if they keep propping up oil and it keeps charging ahead to $65 WTI or higher? Consumption will drop with ferocity.
Then add in Iran oil coming on stream and suddenly there is a glut of oil with lower supply. Does printing money really solve the problem by itself or create greater distortions over time. I can't help but think that at some point when does the reality sink in. That will be the point I speculate that this house of cards re-adjusts faster than most traders will be able to adjust their mindset one day.
Maybe that day is soon. Maybe I got this all wrong and I must continue trading into this pseudo-reality market like we are living in the best of times. Or it's not the market it's me...I am delusional or of schizoid tendency. lol, Any other ideas here please share. https://invst.ly/twdzr https://invst.ly/twee8


bogeygolfFeb 20, 2021 7:15 PM
This argues that MBS investors have been forced to sell long bonds/short last week: https://twitter.com/alexharfouche1/status/1363083796107649024
Agree with every word. Wrote about it many timeshare last week. Convexity hedging has started to add acceleration to bond sell-offs. Surprised some prominent bond commentators can’t see the level of stress in funding markets right now.
(1/2) https://t.co/6DZXmFFHKQ
— a h (@alexharfouche1) February 20, 2021
bogeygolfFeb 20, 2021 7:25 PM
" That explains part of this year’s unexpected rise in 10-year and 30-year bond yields, which in the past week sailed past the 1.25 per cent level. This in turn triggered a wave of hedging activity by leveraged mortgage banks. As interest rates rise, fewer of the mortgages they own are refinanced at lower rates, and so the “duration” of their assets increases.
To offset this ‘convexity’ risk, they have to sell the equivalent of tens, or even hundreds, of billions in Treasury bond derivatives. This is reinforcing the sell-off in Treasuries and threatening a ‘convexity spiral’ of the sort not seen since 2003. Oh, and the increased derivatives activity needs to be collateralised by T-bills, which you will recall are already in short supply.
freer7Feb 20, 2021 1:33 PM
More on the Zoltan article..
Do not rule out a market panic next month
gwizz1Feb 20, 2021 1:37 PM
(1) The issue is (from our understanding): simply put, the Treasury plans on taking down the Treasury General Account ("TGA") from ~$1.58tn to ~$500bn, meaning liquidity is about to flood the system.
Yet, with the Supplementary Leverage Ratio ("SLR") at most banks too high,...
— Gordon Johnson (@GordonJohnson19) February 20, 2021
Alan.LongbonFeb 20, 2021 1:45 PM
That last point about the SLR is a reason that banks might be forced to sell assets to meet the ratio once they have been loaded with bank reserves they do not want or need due to the upcoming policy failure. This orchestrated sort of policy failure is a way that the power elites transfer wealth and power to themselves by taking it off the other less informed market players.
Or do they really think that by curtailing the "debt" that they are helping everybody? Perhaps it helps politically as limiting the debt comes across good with voters who do not understand what is really going on, only that the Fedgov's finances must be like their own (and restraint is a good thing), when in reality as a monetary currency sovereign the Fedgov is unique in that it creates the unit of account and can never run out of it and has a duty to provide enough of it to provide full employment at stable prices and meet the savings desires of the private domestic sector.
nanobrainFeb 20, 2021 9:27 PM
Let`s expand this thought a bit further. Due to the fact that FED can print money and buy whatever the US needs because usd is accepted around the world, hypothetically, they could print (let`s say 50k per person) and hand out the money to US citizen who would never need to work anymore, debt would be increasing but what`s the limit of it in this case?
gwizz1Feb 21, 2021 12:27 AM
Alan.Longbon excellent point - this is where excess liquidity could tank the market rather than help - and while everyone else is expecting the stimmi cheques to boost the market
nanobrain The answer to your question is that the limit is non-monetary but real.
What I mean by that is the capacity problem of the economy is NOT the number of $$ but the scarcity supply of real resources - as Alan Greenspan stated Greenspan: "There is nothing to prevent the government from creating as much money as it wants." in answer to Paul Ryan's question.
There is currently a lot of unused capacity in the US economy (ie a lot of labor is unutilised)
Greenspan: "There is nothing to prevent the government from creating as much money as it wants."
RM13Feb 21, 2021 6:34 PM
How much is Supplemental Leverage Ratio deadline contributing to current bond sell off? That one topic Jeff Snider discussed here.
While Two 'Fs' In Cliff, There Isn't In the SLR Heading Toward One
A few have asked, so I’ve written up what is actually a shorter piece on this SLR business is all about. First, SLR stands for Supplementary Leverage Ratio (and it’s not SLF, as I managed to leave two of the same typos in the main article referenced below, to the point . . .
robert.p.balanModeratorLeaderFeb 21, 2021 10:06 PM
RM13
In March last year, The Fed decided that the SLR needed to be temporarily and selectively suspended, permitting large banks (more than $250 billion in assets) to, “choose to exclude U.S. Treasury securities and deposits at Federal Reserve Banks from the calculation of the supplementary leverage ratio.” It was part of the Fed's calculation that the move will enable the 8 US G-SIBs (Globally Systemically Important Banks) to boost the reflation process after COVID-19 struck in force. The primary dealer banks would be free to buy up all the Treasuries they might want and participate in as much QE as they wished without the resulting increases in buffers, and so balance sheets will not run afoul of the SLR calculations. And they did.
But come March 31, US Treasuries will again be part of the SLR calculations, and banks have to lay out buffers for those securities (however small). The banks are not happy that the "holiday" on US Treasuries will not be renewed. Hence there was this move into T-Bills (which require smaller buffers, as bills are almost "cash"). Bill rates fell (due to demand, and small supply) while long bond yield rose (relatively plentiful supply). That is why bill rates plunged, and long date yields rose. And the yield curved steepened.
But the banks are just like spoiled brats -- well, the Fed let them get away with what is close to resembling murder. This SLR is a joke -- the banks have been able to package really shitty, highly leveraged assets, and have them packaged with credit default swaps which make these rotten fish smelling like roses. The Fed is aware that the spirit of Basel II is being gamed, but the packaged horse crap, is technically sound (until it is not).
robert.p.balanModeratorLeaderFeb 21, 2021 10:21 PM
As JP Morgan showed in a presentation to clients, resumption of SLR will tend to drive deposit rates to negative -- hence a "cliff" but Snider never got around to explaining that because it looks like he did not know the effect. At least he did not even acknowledge that possibility.

RM13Feb 21, 2021 10:38 PM
Thank you Robert. So what will Fed do in response - postpone SLR deadline for another 6 months? Allow crisis in higher longer term rates, short term rates, to institute yield curve control? What's the end game here - for Fed it's always been to change the rules when it doesn't fit the narrative, what's going to change that?
robert.p.balanModeratorLeaderFeb 21, 2021 11:02 PM
Actually Rafa, the markets will be in precarious situation soon -- there are three cliffs that will happening in series. The first is the more than $1trillion drawdown on the TCB -- that could start any day -- that is why I am focusing on the positions taken by the MOTUs -- and it looks like they have been buying hard the past three days -- even as yields are rising just as hard (see chart below). The second is the SLR cliff. The 3rd is the fact that after Q1, the Treasury will stop issuing debt for a while, due to the TCB drawdown.
All of these events have (as yet) un-quantifiable impact on the markets. I am still trying to understand that the aggregate effect all these three events will have. I understand a specific events's consequences, but I am trying to imagine what the sequential effect it may have on markets. We will discuss this at length this coming week.
The Treasury will also issue less debt starting in Q2 2021. During the April – June 2021 quarter, Treasury expects to borrow "only" $95 billion in marketable debt.
The Q2 borrowing forecast of $95 billion compares to $600 billion of debt issuance in the prior quarter (Q1 2021) and a total of $4.3 trillion for 2020. That is largely due to the TCB drawdown which will soon take place.
As NEW TCB and Bank Reserves, including NEW SOMA transactions (the process in which the Fed monetizes the debt issued by the Treasury) are created only by NEW debt issuance, it is not difficult to visualize that these major systemic liquidity spigots will be spewing much less "NEW money" in H2 2021 relative to Q1 2021.
The liquidity drought which just started will be extended for at least another quarter -- that will have a lot of negative impact on risk assets.
freer7Feb 22, 2021 2:17 AM
Thanks Robert for the clear explanation!
I wonder if the MOTUs are frontrunning Powell's speech on Tue. We will know that soon..
bogeygolfFeb 22, 2021 3:44 AM
when the next round of stimulus checks, $1400, we can expect retail to buy call options
robert.p.balanModeratorLeaderFeb 21, 2021 11:14 PM

MOTU Bond positioning and Institutional Bond Purchases are inverted in the chart.
RM13Feb 21, 2021 11:17 PM
Thank you, you've outlined this better than anyone else I've read. Sounds like treasury volatility to me. Curious how each one of these individual components contribute to equity and commodity prices..
robert.p.balanModeratorLeaderFeb 21, 2021 11:17 PM
The MOVE is moving real, quick!
johnmynattFeb 21, 2021 11:53 PM
robert.p.balan In terms of the NQ longs that didn't get stopped out Friday, do you anticipate they will recover before the anticipated larger drops begin, or will they need to be hedged to avoid being stranded for a while? Thanks!
robert.p.balanModeratorLeaderFeb 21, 2021 11:55 PM
No idea yet JohnM -- that is why I want to see the Asian open -- but if you get a chance and you are not sure, better hedge. But take note that if the markets fall out of bed sharply, your longs will be stranded for several weeks.
I will see you all Monday, Feb 22, at Asian trade.
------------------------------------------------------------------------------------
---------------------------------------------------------------------------------------- Here is the current status of the PAM flagship Swing Fund, which includes open and closed trades.
During the twelve months of 2020, PAM delivered phenomenal real-dollar Hedge Fund trading performance, the best at Seeking Alpha:
PAM's flagship Swing Portfolio, year-to-date (December 31, 2020) delivered $100, 181,522.77 net profit on $11,172,813 margin capital.
Year-to-date performance: 860.27%, on 888-98 win-loss trades.
January 2021 spreadsheet here:
Year to date 2020 spreadsheet here.
--------------------------------------------------------------------------------------

Comments
Log in or sign up to join the conversation.