

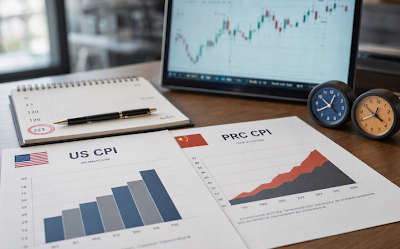
It is too early to have much confidence that the fever in the bond market has broken, but benchmark 10-year yields in North America, most of Europe, including France and Italy, settled lower on the week. The 10-year JGB yield fell seven basis points to return to 3%. Following successful coupon auctions this past week, the 10-year US Treasury yield eased by almost six basis points to settle near 5.25%. The social strife, especially in Spain and France, continues. France's budget issue has not been resolved. Spain will hold national elections in late November. In the US, the risk is for a hot CPI report on Wednesday.
The US dollar rose against most of the G10 currencies. The Scandis and the Australian dollar were exceptions. They rose by about 0.3%-0.5%. Still, the dollar rose to new highs for the year against the euro, Canadian dollar, Swedish krona, and New Zealand dollar. Since returning from the Golden Week holiday, the PBOC set the dollar's reference rate at a new low since early 2023 (CNY6.7330) before the weekend. Although the momentum indicators for the dollar remain mostly over-extended, we are concerned that a firm CPI will translate into a higher dollar.
Three notable developments took place, outside of the calling of a snap Spanish election and the firewall in Germany cracking as an AfD member was elected to a role like speaker of the lower house of the state of Saxony Anhalt. First, the German government doubled this year's growth forecast to 1.3%, which would be the best 2017 due to government spending and strong foreign demand. That is a nice segue into the second development. The EU struck a deal with the EU that will dramatically reduce the imports of Chinese-made hybrid cars. The details are not yet clear, but the Stoxx 600 autos and parts index rallied on the announcement. The arrangement could be sufficient to hold off more drastic action by the EU. Third, adding to the modest stimulus measures already unveiled, at the end of last week, Beijing announced that it would allow provincial governments to access CNY550 bln (~$82 bln) of unspent bond quotas in previous years to help meet this year's growth target.
U.S.
Drivers: The DXY rally from a couple of days before last month's FOMC meeting seemed to have been driven by the sharp rise in US rates. The US two-year yield peaked on September 29 near 4.96%. The Dollar Index may have peaked a few days later on October 5. The rolling 30-day correlation of the changes in DXY and the two-year US yield fell from nearly 0.60, the upper end of a three-month range to a little below 0.35, the lowest since March. The strength of the US economy owes in no small measure to government and household borrowing. No other major high-income country is willing to borrow as much as the US as a proportion the its annual output. Wages have not kept up with US inflation for the last five months, the Conference Board and the University of Michigan, surveys point to dismal consumer confidence, yet consumption remains strong, in part, with the help of a 35% increase in the extension of consumer credit, more home-equity loans and drawdown of financial assets (savings).
Data: The US CPI on October 14 is arguably the most important data point of the week. In the three months through August, headline CPI rose at an annualized pace of 0.4%. The core rate has risen by 2.0% at an annualized pace. The PPI is also important, but especially because it provides inputs to the forecast of the PCE deflator, which the Fed targets. The retail sales and industrial production reports may help economists tweak Q3 GDP forecasts. The median projection in Bloomberg's most recent survey is for 2.8% annualized pace, while the Atlanta Fed's GDPNow tracker is 3.6%. The US corporate earnings season kicks into high-gear with the large banks reporting. Bloomberg's survey found expectations that Q3 S&P 500 earnings increased 25% from a year earlier.
Prices: The risk is that an acceleration of US inflation pushes the pendulum back toward a more aggressive Fed stance. The market has been vacillating between discounting 75 bp and 90 bp of rate cuts by the end of H1. The pendulum is at the lower end of the range now. A rise in short-term US rates may see the correlation with the Dollar Index improve from near six-month lows.
EMU
Drivers: The strife in Spain, France, and Germany and dramatic widening of the core-periphery spreads made the dollar, even if, more so, the Swiss franc, a bit of a safe haven. But unlike the Swiss franc, one is paid to be long dollars, in the sense that US ultra short-term rates are above Europe's. At the same time, US equities continue to outperform Europe (over the past three months and year-to-date). The rolling 30-day correlation of the changes in the euro and the German premium over France was slightly inverse as recently as September 22. It was first inversion since January. It is now a little above 0.50, the highest since early June.
Data: August industrial production and trade figures will be reported this week. The markets do not often react to these aggregate figures even if they inform the economic assessments. After growing by 0.6% in Q2 (following a flat Q1), the eurozone economy is expected to grow more steadily but around 0.3% a quarter for the next several quarters.
Prices: The euro fell to almost $1.1160 at the start of last week, its lowest level since May 2025. It reached almost $1.1280 the following day. It chopped in that range for the rest of last week. It does not to have put in an important low yet. Since breaking $1.13 or so, we have warned of risk toward $1.11, which corresponds to the (50%) retracement of the euro's rally from last year's low (~$1.0140). A break may find initial support around $1.1050, but the next retracement target is near $1.0880.
PRC
Drivers: Coming back from the extended national holiday, the market will look for clues of Beijing's intent from the dollar's fix. During the holiday, the offshore yuan chopped the range it set in the week before the holiday. It almost seems as if the market is reluctant to push much below CNH6.70 (~CNH6.6910 was the low on September 21) without continued official confirmation. At the end of last week, the PBOC fixed the dollar at a new three-year low. The signal is that Beijing favors managed gradual appreciation over a rapid adjustment.
Data: Three data points will capture the market's attention this week. Beijing reports September CPI, PPI, and trade figures. Headline CPI rose 0.8% year-over-year in September, while the core rate was 1% higher. Producer price inflation rose to 3.8% year-over-year from 3.5% in July. It peaked at 4.1% in June. The trade surplus continues to be a source of tension especially but not only the US and Europe. It averaged $100.7 bln a month in the first eight months of the year. In the Jan-Aug 2025 period, the monthly average was $97.7 bln. In nominal dollar terms, August exports had risen by a quarter compared with a year ago. Imports were up a little more (28.2%). At the end of last week, reports indicated that Beijing would allow the provinces to access CNY550 bln (~$82 bln) in unspent bond quotas from previous years. This is part of the stimulus effort to support the economy.
Prices: Encouraged by the PBOC's fix before the weekend, the market took the dollar to nearly the four-year low against the offshore yuan recorded on September 21 (~CNH6.6910). The CNH6.67 area may be the next initial target but there may be scope toward CNH6.60 by the end of the year. The median forecast in Bloomberg's survey sees the dollar finishing the year at CNH6.70.
Japan
Drivers: Changes in US two-year interest rates and the dollar-yen exchange rate are not as correlated as they were in May (~0.67) over the past 30 sessions, but it is well above the low in early August (slightly below 0.20) at almost 0.50. The correlation between the exchange rate and the US 10-year yield nearly reached 0.50 in late September. It is now near 0.40. After the intervention, it briefly was inverted. Recent comments by BOJ Governor Ueda have given the market no reason to expect back-to-back hikes and the swaps market has downgraded the chances of a hike later this month to about 10% from around 40% two weeks ago.
Data: Japan reports September producer prices, core machine orders, and the final estimate of industrial production. The data, however, are unlikely to rebuild expectations for a hike at the end of this month. The swaps market is pricing in around a 20% chance, down from 40% as recently as September 28. Japan's economy grew at an annualized rate of 1.9% in Q1, 1.4% in Q2, and the median forecast in Bloomberg's survey is 1.0% in Q3 (and Q4).
Prices: The dollar traded in a little more than a one-yen range below about JPY158.50 last week. It is knocking on the 200-day moving average (~JPY158.55) but has not closed above it since September 2 with the exception of September 24. It roughly corresponds to the (50%) retracement of the dollar losses from the 40-year high on July 23 near JPY164. The daily momentum indicators are stretched but still moving higher and US yields do not appear to have peaked. A push above the JPY158.55 area sees the late September high, near JPY159 next, and the September high was closer to JPY160.40. The market will feel more comfortable challenging the JPY160 area with fundamental cover, like a firm US CPI reading.
UK
Drivers: The rolling 30-day correlation of changes in sterling and UK's two-year yield has not been positive since early April. It is around -0.05, though it did approach -0.50 in June. The correlation of the exchange rate and the US two-year yield is near -0.25. The inversion is more intuitive than with UK rates. Sterling accounts for a little less than 12% of DXY, yet its 30-day inverse correlation is almost 0.80. The euro, which is about 57% of DXY, has an inverse correlation of nearly 0.90.
Data: The week's highlight is the August GDP and details on October 15. The UK economy has been unexpectedly resilient in H1. It grew by 0.6% quarter-over-quarter in Q1 and 0.5% in Q2. It seems off to a fine start in Q3 after July's growth was estimated at 0.4%, the quickest since February. Economists surveyed by Bloomberg anticipated growth slowed to about a 0.2% in Q3, primarily because of projections for slower fixed investment and worsening net exports. The market may be particularly sensitive insight into these sectors.
Prices: For a little more than two weeks, sterling has been chopping in a range, slightly above the low recorded in late June (~$1.3140). Since it broke below $1.33 on September 23, sterling has not managed to close back above it but has not traded below $1.3180 either. Sterling might have traded heavier against the dollar if it were not for the demand on the cross against the euro. The euro was sold to a marginal new low for the year in middle of last week, slightly below GBP0.8450. It does not appear to have bottomed, and near-term potential may extend toward GBP0.8400.
Canada
Drivers: The most important weight that has dragged the Canadian dollar persistently lower has been the inability of Canadian rates to keep up with US rates. The policy rate differential in this cycle is the widest since the late 1990s. The same can be said of the US two-year premium over Canada. The rolling 30-day correlation of the change in the exchange rate and the US premium is around 0.60. It was inverse in late May through mid-June. Changes in the exchange rate are less correlated with changes in Canadian or US two-year rates, and that holds for 10-year yields as well. Some observers still insist that the Canadian dollar is a petro currency but the correlation between the USD-CAD exchange rate and WTI has had three phases this year. Through much of the Q1, there was an inverse correlation that reached -0.44 before the Middle East war. The correlation turned positive, which is to say the Canadian dollar tended weaken against the US dollar as oil prices rose, and stay positive through early July. It is now inverted again, around -0.22.
Data: The disappointing employment report before the weekend, which saw Canada lose more than 35k full-time jobs for the second consecutive month saw the market downgrade the chances of a 25 bp hike before the end of the year to about 85%, the least in about a month, from more than 100% the previous week. The Bank of Canada's decision on October 28 does not hinge this week's data, which is mostly housing starts, building permits, and existing home sales. The monthly portfolio flow report at the end of the week will underscore what we already know; namely the improvement in Canada's external balance this year. Consider that through July, foreigner investors bought a net of almost C$180 bln of Canadian bonds and stocks. In the same period last year, foreign investors bought C$3.5 bln. At the same time, Canada merchandise trade balance has swung into a nearly C$5 bln surplus from a deficit of almost C$22 bln in the first seven months of 2025.
Prices: If the policy and rate gap have weighed on the Canadian dollar, the poor jobs data and the prospect of a firm US CPI reading, warn against expecting near-term convergence. The US dollar held support near CAD1.4200 after testing it several times in recent days. The CAD1.4300 area, which has been approached, corresponds to the (61.8%) retracement of the greenback's losses since the 2025 high, near CAD1.48. A push above CAD1.4300 could target the CAD1.4400-20 area next.
Australia
Drivers: Changes in the Australian dollar's exchange rate and the Dollar Index are inversely correlated (~-0.62), and a smidgeon more but positively correlated with changes in the S&P 500. Similarly, the Aussie is inversely correlated with changes in the two-year US yield (~-0.55) and is nearly as positively correlated with changes in gold (~0.50). Changes in the exchange rates and Australia's two-year yield is near 0.20 and the correlation with the two-year differential is almost 0.50.
Data: The minutes from last month's central bank meeting that resulted in a dovish hike may offer insight on October 13 of the significance of the September employment data on Oct 15. Although Australia lost full-time positions in August (6.3k) the three-month average of a little more than 18k is at the upper end of where it has been for the past couple of years. The economy has added an average of 20.4k jobs a month this year through August, compared with 8k average in the first eight months of 2025. The unemployment rate has marched steadily higher from 4.1% in January to 4.6% in August, the highest level in five years. Job growth trails the rise in the participation rate, which has risen this year from 66.7% in January to 67.1% in August. That matches the high since January 2025.
Prices: The Australian dollar consolidated last week between about $0.6930 and $0.6990. It recorded a three-month low on October 1 slightly above $0.6900. The Aussie must re-establish a foothold above the $0.7030 area to lift the tone. That area holds the (38.2%) retracement of the losses from the September 9 high (~$0.7240), the 20-day moving average, and the 200-day moving average. The momentum indicators are turning up but still overextended.
Mexico
Drivers: The minutes from the recent central bank meeting struck the market has more dovish than expected. A majority said they would be willing to consider a rate cut if inflation conditions permitted. It sounds conditional and benign, but when coupled with the signal that it would not react mechanically to what the Federal Reserve does, and elimination of the phrase from previous statements that is expected to hold rates steady, gave the dovish tilt to the third consecutive meeting that the central bank stood pat. This sent the peso reeling. The Mexican peso is often best thought of as a proxy for emerging market currencies broadly. The correlation of the dollar-peso exchange rate and the JP Morgan Emerging Market Currency is fairly stable and robust. The 100-day rolling inverse correlation of change in the two is near -0.73. The 30-day correlation is around -0.76. Changes in the dollar-peso exchange rate over the 30 sessions are more correlated with silver (~-0.40) than gold (~-0.30). The exchange rate correlation with changes in the US 10-year yield over the past 30 sessions than with changes in the US two-year yield have converged around 0.35.
Data: Mexico reports August industrial production on October 12. It has been a choppy time series this year. In the first seven months, it contracted three times, yet it has risen by an average of 0.16% a month compared with an average of 0.01% a month in Jan-July 2025. Mexico's merchandise exports were about 36% of GDP last year. Its goods exports have risen by about 30% this year. The domestic economy looks weak, and growth might have nearly stalled in Q3 after a 1.4% quarter-over-quarter surge in Q2 (-0.3% in Q1).
Prices: The dovish Banxico minutes trigger sharp losses of the peso. Before the weekend, it reached new lows since last November. The dollar reached almost MXN18.50. Between the BOJ intervention and encouraging the unwinding of yen-carry trades and then the jump in US rates, forcing the unwinding dollar-funding trades, the peso was already on the defensive. Even though Banxico's rate guidance was conditional, the market understood the dovish bias. The next target may be around MXN18.55, which corresponds to the (38.2%) retracement of the greenback's decline from the February 2025 high (~MXN21.2930). Above there, and the high from last November (~MXN18.77 comes into view).


Comments
Log in or sign up to join the conversation.