
ISM Non-Manufacturing PMI Misses Estimates
Most of the economic data is coming in weak and missing expectations. With the market mostly past earnings season, these reports should be highlighted, causing stocks to fall.
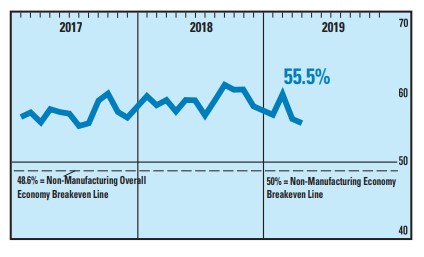
As you can see from the chart below, the April ISM non-manufacturing PMI fell from 56.1 to 55.5 which missed estimates for 57.3. It matched the low end of the estimate range.
I don’t understand why economists would expect this index to increase in a slowdown. Investors have entertained the possibility of a rebound later in the year, but we’re not there yet.
You can see that with the 2 disappointing ISM readings. Both are at 12-month lows. This the 2nd straight sequential decline in the non-manufacturing PMI. It is below its 12 month average of 58.4. This is the lowest PMI since July 2017.
(Click on image to enlarge)
Good news is the business activity index increased 2.1 points from 57.4 to 59.5. However, new orders fell 0.9 to 58.1 and employment fell 2.2 to 53.5. None of the indexes were below 50 as the lowest was supplier deliveries which fell 1.5 points to 50.5. The biggest decline was in inventory sentiment which was down 2.5 points to 60. The biggest increase was in new export orders which was up 4.5 points to 57. That is consistent with the solid export growth in Q1.
Finally, the prices index fell 3 points to 55.7. It’s above the manufacturing reading which was 50, but it shows the same trend of declining price growth. Inflation was weak in March. It will likely be weak in April again. The April CPI report comes out next Friday.
The consensus is for yearly headline inflation to increased from 1.9% to 2.1% and for core inflation to increase from 2% to 2.1%. I wouldn’t be surprised if core inflation misses estimates. I think headline inflation will be above core inflation because of increasing energy prices.
Weak Service Sector - Q2 GDP Estimates
Even though the non-manufacturing PMI is above the manufacturing PMI, it’s consistent with lower GDP growth. The services PMI is consistent with 2.4% GDP growth which isn’t far from most Q2 estimates.
As you can see from the chart below, the median Q2 GDP forecast is for 2% growth. The next update to the Atlanta Fed Nowcast is Thursday. Estimates for quarterly growth aren’t accurate now, but they tell us what the reported data is consistent with. It’s entirely possible that headline growth is worse than Q1, but the underlying data improves. If the underlying data doesn’t improve, sub-2% GDP growth is likely.
(Click on image to enlarge)

Weak Service Sector - Quotes From ISM
Manufacturing ISM quotes were all about the negative impacts of tariffs. Unfortunately for them, it looks like the possibility of higher tariffs has increased recently. Now let’s look at the quotes from the non-manufacturing report.
A wholesale trade firm stated, “We had a general slowing of business activity beginning in February. We initially believed that February’s slowness was primarily weather-related, but the slowness continued into March and now April.” That’s interesting because it means weather problems weren’t the cause of earlier weakness. This causes investors to re-think past results. I’m always skeptical when firms blame the weather because it can be a cover up for weak demand.
You must do the research to point to exactly which weather event did the damage. Firms aren’t always lying; there is sometimes support for their claims. I can’t do the research on this company because it’s anonymous.
A construction company stated, “Spring selling season is here for residential construction. Sales are coming, but negotiations are now the norm. Traffic is higher than the last three months, mostly due to lower mortgage rates.” That’s interesting because MBA purchase applications growth was strong in March but then cratered in April.
It’s good to see this firm saying there is traffic growth because the Housing Market index stated traffic fell at a reduced rate. The index was 47 in April; anything below 50 signals a decline. Mortgage rates are definitely the biggest reason for demand improvement. However, if price growth keeps falling, that will also spark interest from home buyers. The fact that negotiations are the norm shows us this is a buyers’ market. It also shows price growth might continue to drop.
Weak Service Sector - Markit Services PMI Also Falls
Markit Services PMI fell from 55.3 to 53 which beat estimates for 52.9. In this report, economists were correct in their assertion that the index would fall. This weakness in services caused the overall PMI to decline from 54.6 to 53 which slightly beat estimates for 52.8.
Just because results were beaten, doesn’t make this a good report. Business activity growth was the slowest since March 2017. Business expectations were the lowest since June 2016. Inflation pressures fell. New business growth was the weakest in 2 years. Low input price growth was catalyzed by the decline in raw material price growth. Output inflation was the slowest since October 2017. The rate of job creation was the slowest in 2 years. Finally, backlogs increased for the 4th straight month.
Composite PMI was the lowest since March 2017.
Overall, new order growth was the slowest in 24 months. Input price growth was the slowest since September 2016 and output price growth was the slowest since October 2017. Employment growth was the slowest in 2 years. Finally, business expectations were the worst since June 2016. Almost everything in this report is consistent with an economic slowdown, not a euphoric rise in stock prices.
According to the comments section of the Markit report, this composite reading is consistent with 1.9% GDP growth. As I mentioned, GDP estimates are for 2% growth, meaning this Markit report is more in-line with reality than the ISM report. In the recent past, Markit reports have been more realistic.
Remarkably, the American services and manufacturing PMIs are above the global average. That shows how bad the global PMIs were. The global services PMI fell from 53.7 to 52.7 and the global composite PMI fell from 52.7 to 52.1.


Comments
Log in or sign up to join the conversation.