

EUR/USD
4 hour
(Click on image to enlarge)
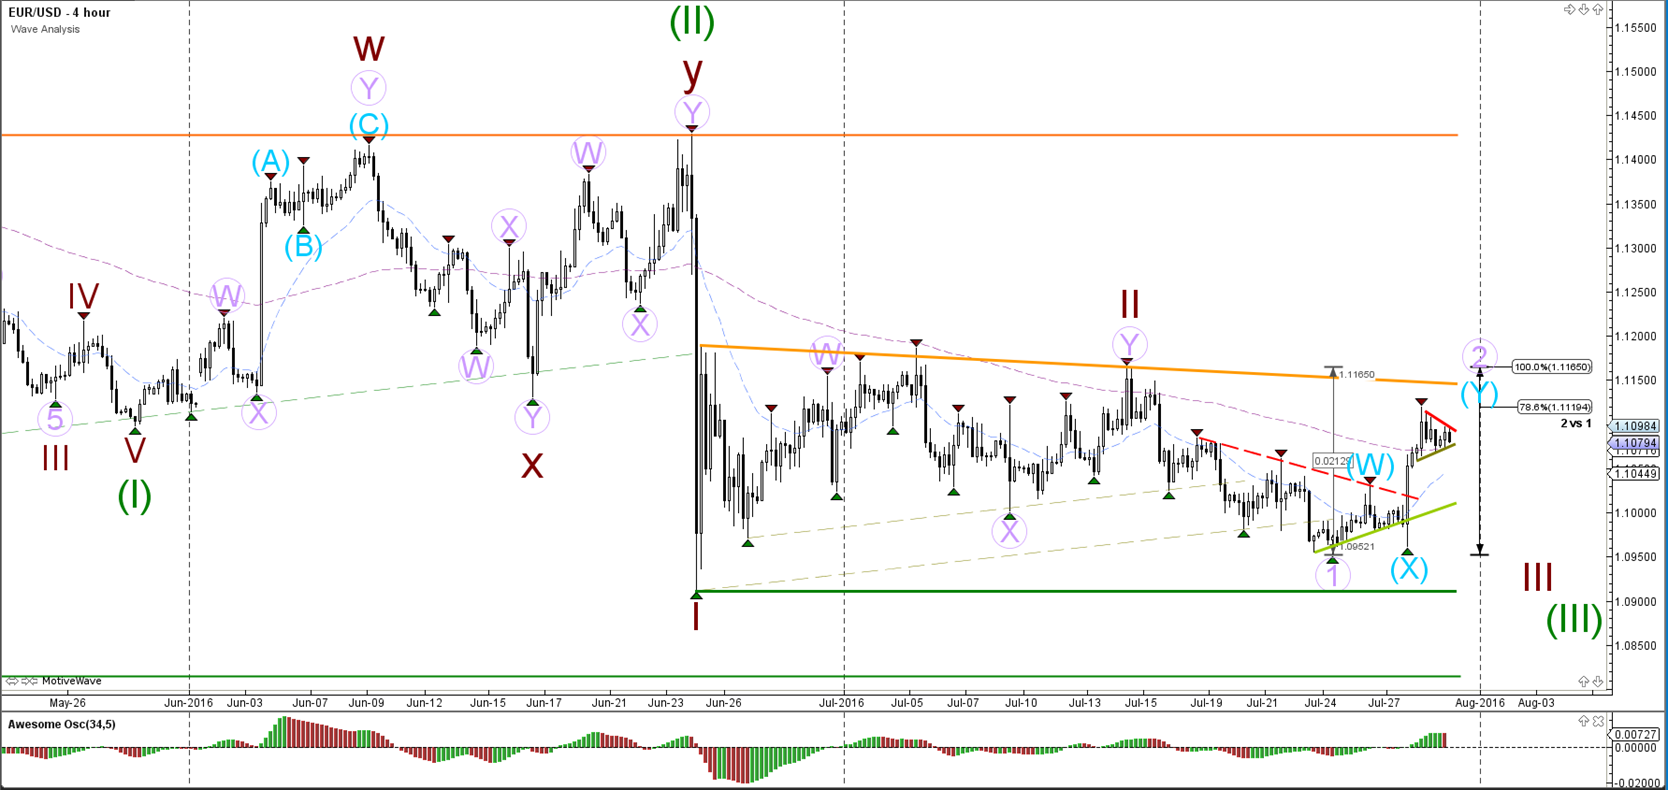
The EUR/USD continues its long-term consolidation pattern by staying between support (green) and resistance (orange). A bearish breakout is needed before the wave count is confirmed whereas any move above the 100% Fib level invalidates wave 2 (purple).
1 hour
(Click on image to enlarge)
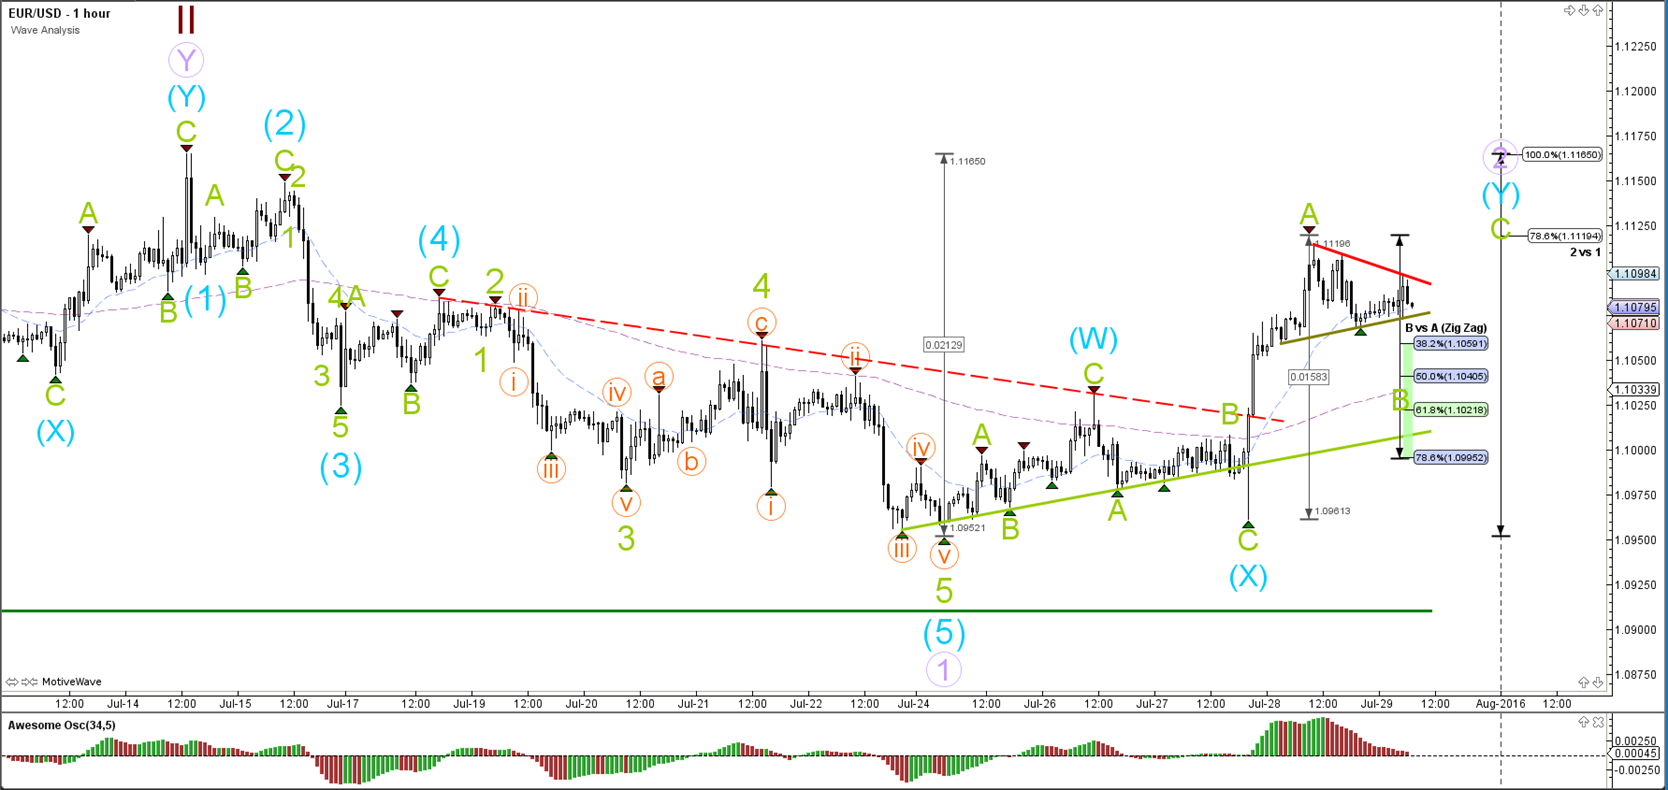
The EUR/USD is building a smaller triangle (red/green). Due to the strong momentum seen in wave A (green), it seems more likely that a wave B and C (green) will follow. A break below the 78.6% Fibonacci level increases the likelihood of wave Y (blue) completed at the recent top.
GBP/USD
4 hour
(Click on image to enlarge)
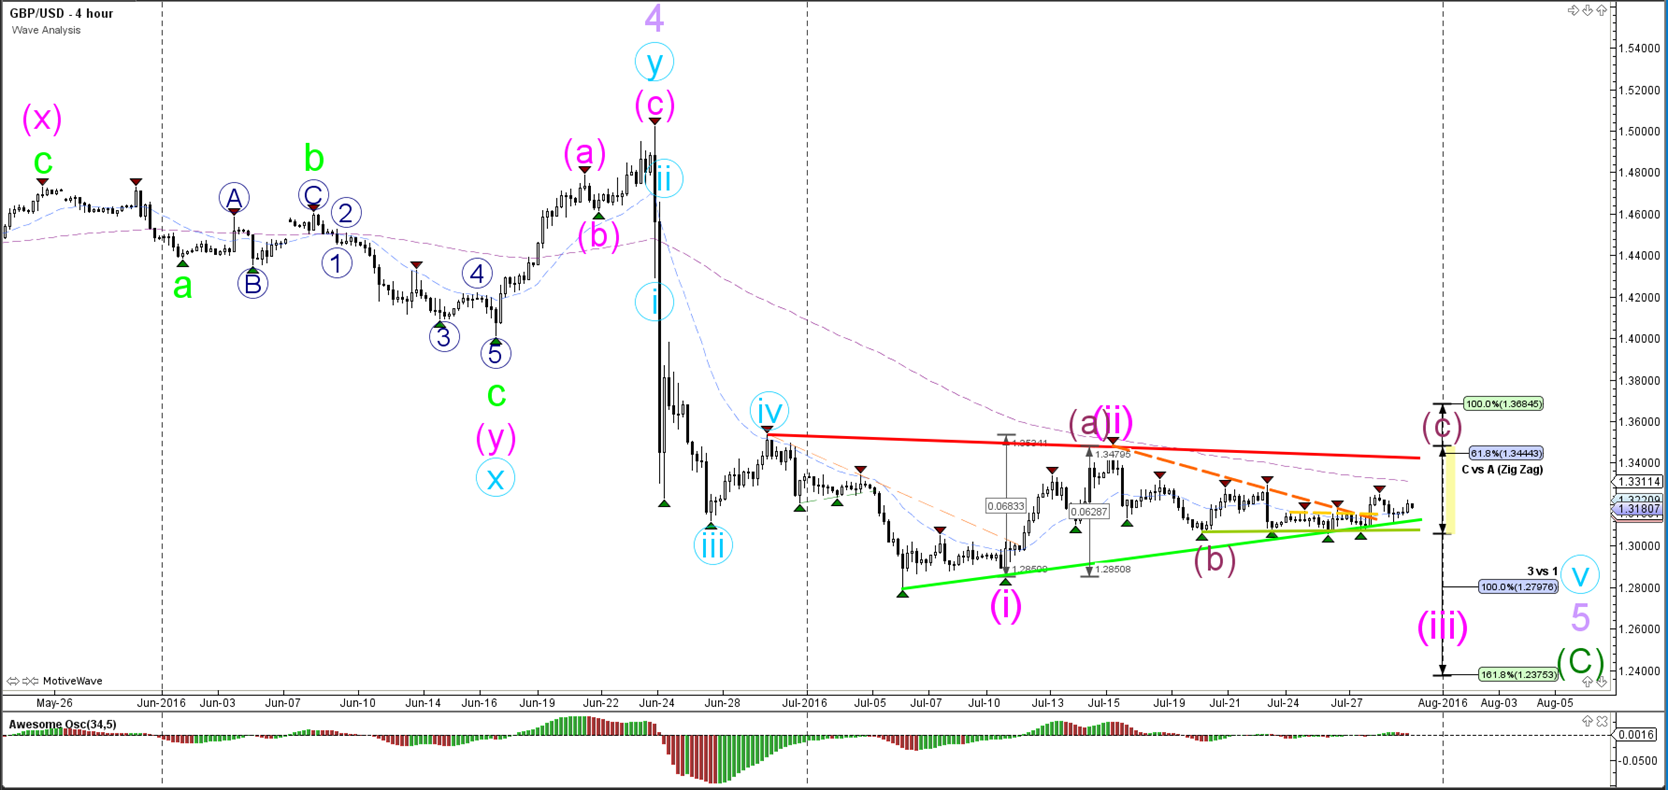
The GBP/USD seems to have found a temporary equilibrium and is building an extensive sideways movement. The triangle chart pattern (green/red) will need a breakout to decide whether the Cable is bullish or bearish. Price is either in a bearish 123 (pink) or in a bigger ABC retracement (purple).
1 hour
(Click on image to enlarge)

The GBP/USD is building an ABC (grey) bullish zigzag. A break below the support trend lines (green) could indicate the end of the correction.
USD/JPY
4 hour
(Click on image to enlarge)
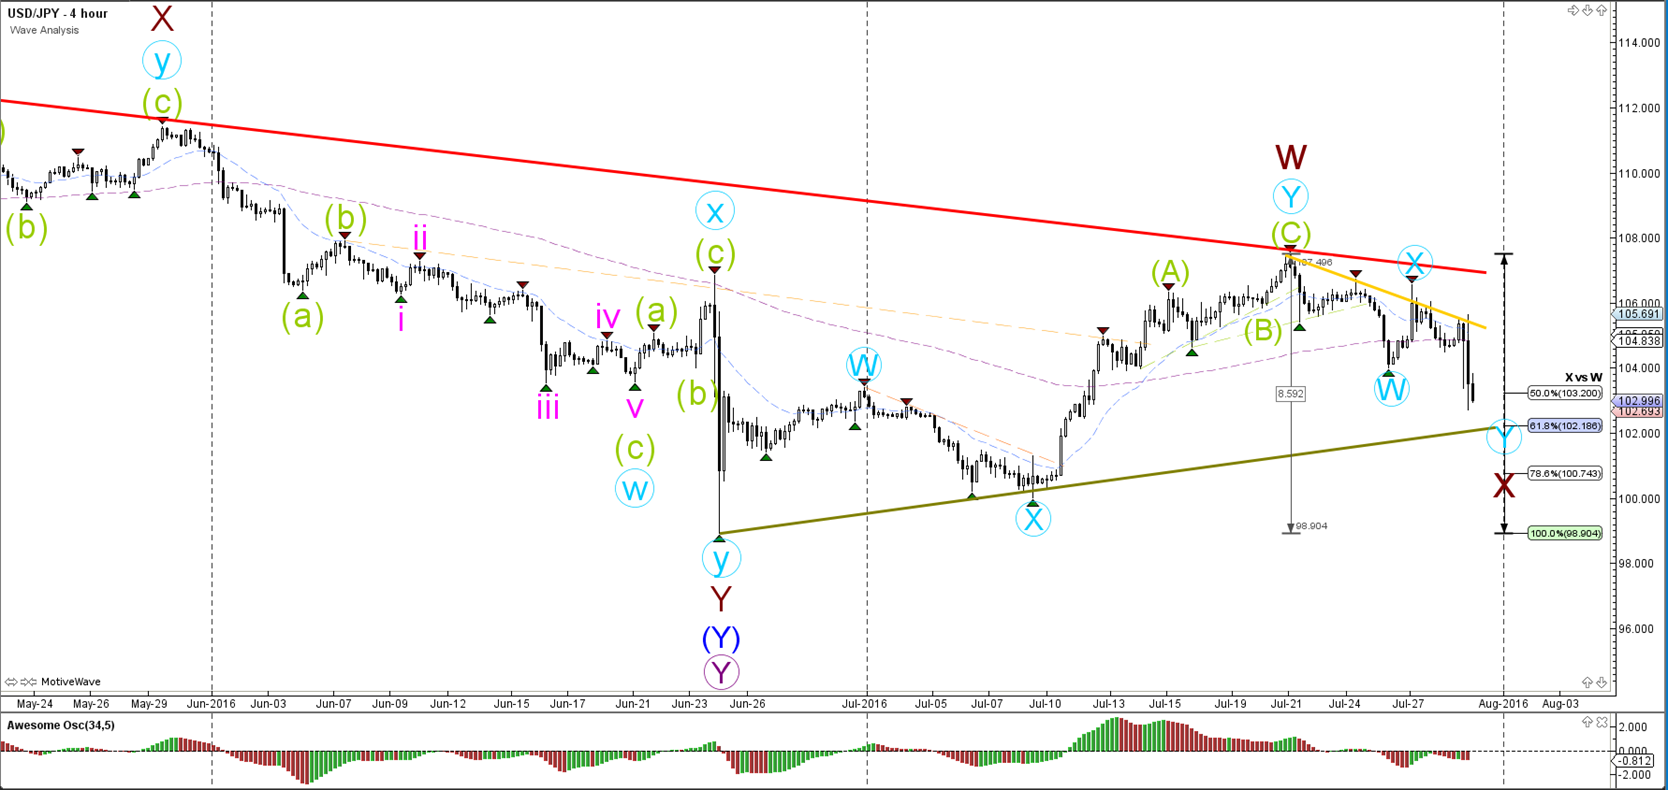
The USD/JPY is in a bearish correction and retracing back to Fibonacci levels of wave 'X vs W'.
1 hour
(Click on image to enlarge)
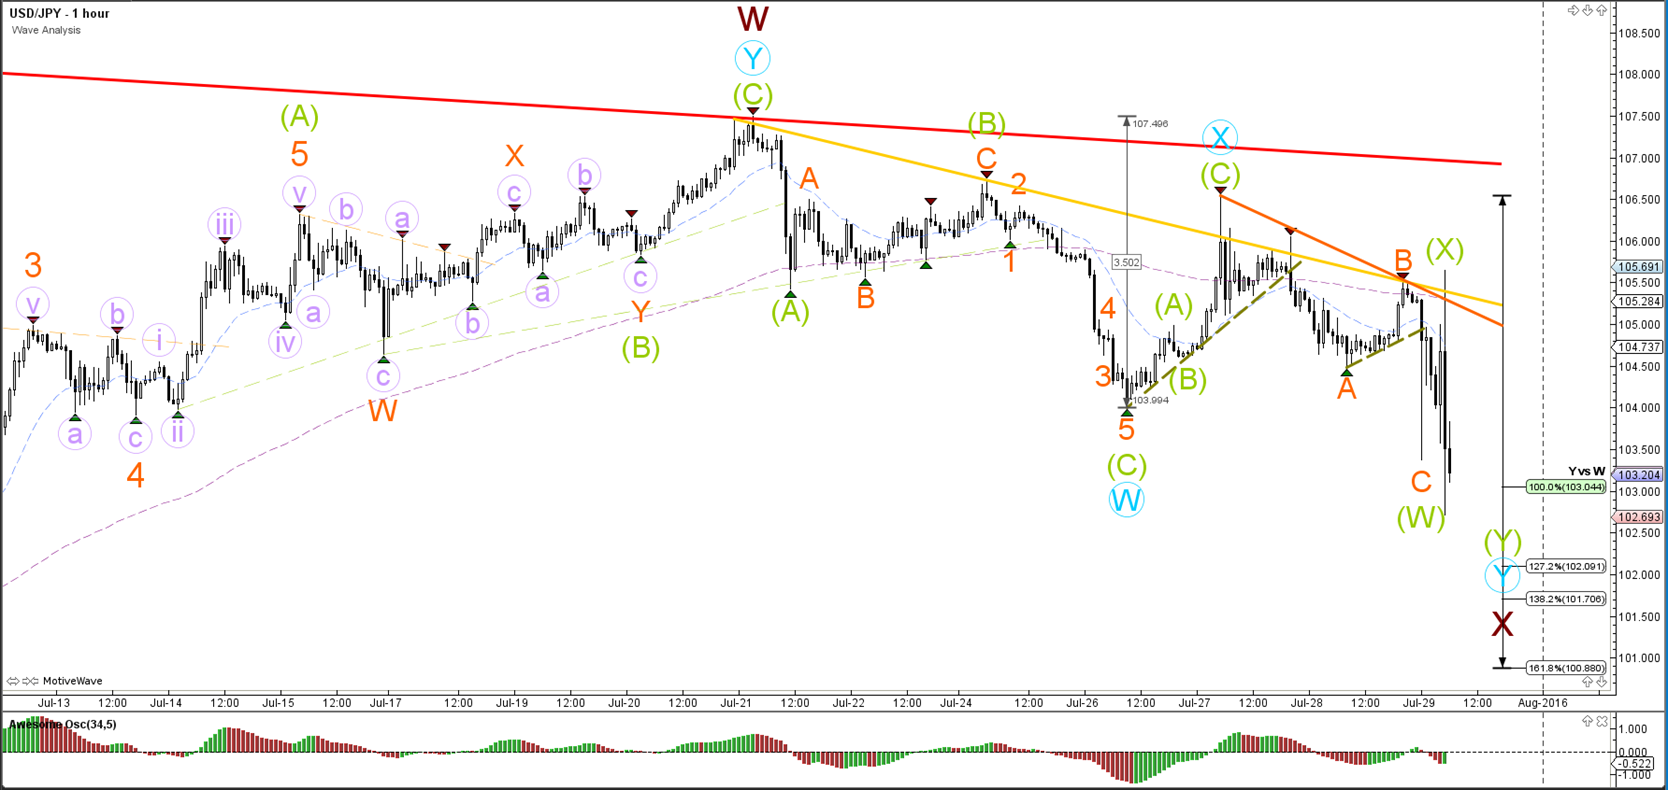
The USD/JPY showed a lot of volatility but was not able to break above the resistance (orange). It is now moving towards the Fibonacci targets.



Comments
Log in or sign up to join the conversation.