

Overview
War and its impact on oil, LNG, and fertilizer supplies and pricing—and by extension the impact on inflation, supply chains, bond yields and mortgage rates, dollar strength, global liquidity and global GDP—continue to top the headlines. And as if that’s not enough, we have our worsening political polarization, an utterly feckless US Congress, and complete lack of bipartisan agreement on anything, with the severe fallout of no DHS funding and long TSA lines at the airport. And lest we forget, we have rising debt and expanding deficits, sticky services inflation, and a softening labor market with falling job openings, layoffs, stalled wage growth, and new college graduates facing rising unemployment. But the buildout of physical AI infrastructure is creating real ROI, wealth creation, and productivity gains, and the companies building the AI compute stack have been delivering incredibly bullish earnings calls and forward guidance—and they are not dissuaded in the least by any of those onerous macro issues.
The doomsayers have been joined by the realists and pragmatists in believing there is no escaping $150/bbl oil and an economic recession, depending upon how much longer the oil market and energy supply chain disruption goes on—leaving only the eternal optimists to carry the bullish flag. History shows that stocks tend to recover nicely following military conflicts that are resolved relatively quickly, finding a bottom concurrently with the peak in oil prices. But production and refining capacity take to time to bring back online, and destruction of energy infrastructure among the Gulf Cooperation Council countries (GCC—Bahrain, Kuwait, Oman, Qatar, Saudi Arabia, and UAE) can take years to rebuild. If the Iranian regime tries to take it all down concurrent with their own demise, including crippling their own Kharg Island facilities—the future of their own citizens be damned—then the near-term future indeed may be challenging (or even bleak).
The war continues to consume precious resources and disrupt the global economy, as the whole world waits out with bated breath each missile launch and utterance from our president. President Trump’s goals are to defang Iran’s military and long-range missile capability, nuclear infrastructure, and terrorist network, and decapitate its radical, hateful, theocratic regime (and hopefully usher in a friendlier government) without destroying the civilian infrastructure and power grid so that the Iranian people (and the country’s future) aren’t catastrophically crippled. Indeed, rather than Trump “TACOing” again on harsh escalation (i.e., chickening out, as his critics accuse him of), I believe it is really an indication of his desire not to cripple Iran’s future as a thriving participant in the global economy. Trump doesn’t require a secular democracy there; he just wants to see a responsible, approachable government that doesn’t oppress its people, threaten all non-believers with death, aspire to a global caliphate, or zealously pursue an apocalyptic ending that ushers in the “Twelfth Imam.”
What’s left of Iran’s tyrannical regime is behaving like the Black Knight in the old comedy movie, Monty Python and the Holy Grail. Although thoroughly defeated, the regime just keeps on with its impotent saber-rattling. “It’s just a flesh wound!” the Black Knight exclaims after King Arthur chops off his arm. And after the king has chopped off all his arms and legs, the Black Knight says, “Alright, we’ll call it a draw.” Here’s the 4-minute clip.
Unfortunately, enough market participants are worried that maybe the Iranian regime’s bluster has a kernel of truth, or that US boots on the ground will lead to intolerable death and destruction in a bloody effort to take control of Kharg Island and ship traffic in the Strait of Hormuz. My view is that the regime is flailing like the Black Knight, and that the end is near. No money, dwindling munitions and resources. JP Morgan CEO Jamie Dimon opined that he is optimistic about the aftermath of the war given the new mentality across the region born of recent strong economic growth that has been creating incentives for stability and a desire among the GCC for a “permanent peace in the Middle East” that would open the region to foreign investment and robust growth. He said, “The Iran war gives it a better chance in the long run; [but] it’s probably riskier in the short run." BlackRock’s Larry Fink sees just two extreme potential outcomes with no middle ground: either we see growth, abundance, and $40 oil, or we see global recession and years of $150 oil. It’s worth noting that spikes in oil-to-natural gas ratio historically have receded within a few months; however, destroyed energy infrastructure could easily change this dynamic.
Since its all-time high of 7,000 on 1/28, the S&P 500 is down about 9% (as of 3/30), which means it has lost over $5 trillion in market cap, mostly due to fear-driven selling but also profit protection, capital preservation, and algo trading that is now short-biased. On Friday 3/27 alone, the MAG-7 stocks shed $330 billion in market cap. Traders have been clearing out positions ahead of each weekend due to uncertainty about war escalations. Even holding overnight is worrying for them. The Dow and Nasdaq have fallen more than 10% (i.e., correction territory). Investor trepidation has led to beat-and-raise earnings reports from dominant Tech companies being met with selling—notably Micron (MU) and its incredible quarterly report that confirmed huge demand for AI memory, as well as NVIDIA (NVDA) and its 73% YoY revenue increase that defied the “law of large numbers” for the largest market cap company in the world. Despite seeing its market cap contract for over $5 trillion to closer to $4 trillion, NVIDIA remains an incredibly profitable company with remarkable margins and ROE, and an index weighting of about 8% of the S&P 500—which is more than the weightings of 5 of the 11 GICS sectors (Consumer Staples, Energy, Utilities, Materials, and Real Estate).
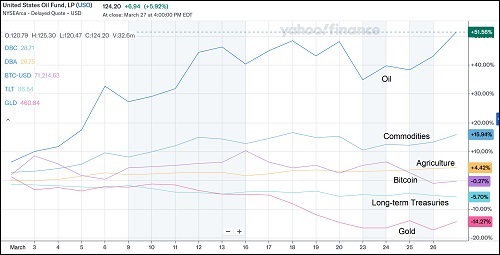
The forward P/E on the S&P 500 has fallen from a high around 23x to around 20x today, which is near its 10-year average, The CBOE Volatility Index (VIX) closed last week in panic territory above 31. Bonds have offered no safe haven as auctions have seen limited demand. Nor have gold, silver, and crypto as the US dollar has firmed up and central banks, which had been accumulating gold in a big way, find they desperately need to sell non-interest-bearing assets (like gold) to raise money to either offset lost oil export revenue or to pay the surging price of oil imports. But money is flowing into hard assets, like oil, agriculture, industrial metals, and commodities broadly. Some say the dominos are stacking up much like 2008, this time driven by surging oil prices and a potential meltdown in private credit. The chart below shows the divergent performance of various asset class ETFs, including oil (USO), commodities (DBC), driven mostly by oil and gasoline prices which have seen their biggest surge in four years, agriculture (DBA), bitcoin (BTC.X) (BTC-USD), long-term US Treasuries (TLT), and gold (GLD).
This market correction has served to reset lofty valuations in prominent names that many investors want to own for the long term. Keep in mind, large capital spending commitments for AI, defense, and energy projects persist and even grow, such as Meta Platforms’ (META) announcement of an increase in its investment in a state-of-the-art, 1.0 GW AI datacenter in El Paso, Texas, raising its projected capex for the project from $1.5 billion to over $10 billion, as part of a total $135 billion capital spending plan for 2026, creating 4,000 construction jobs and ultimately 300 permanent operations jobs. Moreover, it will be water-positive by employing a closed-loop cooling system, and the company will fully fund all associated infrastructure and power grid connections. This is why engineering & construction firms like Comfort Systems (FIX)—the top performer in our next-to-terminate Q1 2025 Baker’s Dozen—and Sterling Infrastructure (STRL)—a top performer in our Q2 2025 and Q3 2025 Baker’s Dozens—have held up so well despite the profit-taking in their benefactors. I talk more about these firms in my full commentary.
The One Big Beautifull Bill Act (OBBA) has fully kicked in, with its tax reform, deregulation, pro-energy policies, and broad support for the private sector to retake its rightful place as the primary engine of growth via re-privatization, reshoring, and re-industrialization, with much more efficient capital allocation and ROI than government. US corporate earnings are expected to increase by 17% YoY in full-year 2026, according to FactSet—the most since the post-pandemic recovery and a level more typical of an economy emerging from a recession—as analysts keep revising upwards even as share prices fall. However, as DataTrek pointed out, while earnings growth isn’t a concern, Big Tech reinvestment rates are a concern (i.e., capex/cash flow ratio). To be sure, analyst optimism on earnings assumes only a temporary war shock and continued tech strength. As Barclays sees it, “There is a wall of worry—but it’s worth climbing.”
Yes, the Iran hostilities have created vast uncertainties and impacts on energy and supply chains—and by extension inflation. But I still think the overall picture suggests room for another Fed rate cut (certainly not a rate hike!).
Looking ahead, stock market performance should be more dependent upon earnings growth and ROI rather than multiple expansion—although with this market correction, valuations have pulled back to the 10-year average, which may leave room for some multiple expansion as well. But regardless, rather than the broad passive indexes (which are dominated by growth stocks, Big Tech, and the AI hyperscalers), I think 2026 should continue to be a good year for active stock selection, small caps, and bond-alternative dividend payers.
Also, small caps and high-dividend payers tend to benefit from falling interest rates and market rotation—which should resume as the war comes to a (hopefully swift) resolution. Roughly 2/3 of Russell 2000 companies topped Q4 earnings expectations, which is the best beat rate since 2021 (coming out of the pandemic). So, Sabrient’s quarterly Small Cap Growth and Dividend portfolios might be timely investments. And, as a reminder, our Earnings Quality Rank (EQR) is licensed to the actively managed, low-beta First Trust Long-Short ETF (FTLS) as a quality prescreen. Worth checking out.
I have been imploring investors in my recent posts to exploit any significant market pullback by accumulating high-quality stocks as they rebound, with earnings fueled by massive capex in AI, blockchain, energy, and onshoring of power infrastructure and factories, leading to rising productivity, increased productive capacity, and economic expansion. By “high-quality stocks,” I mean fundamentally strong, displaying a history of consistent, reliable, resilient, durable, and accelerating sales and earnings growth, positive revisions to Wall Street analysts’ consensus estimates, a history of meeting/beating estimates, rising profit margins and free cash flow, high capital efficiency (e.g., ROI), solid earnings quality and conservative accounting practices, a strong balance sheet, low debt burden, competitive advantage, a wide moat, and a reasonable valuation compared to its peers and its own history.
Market Commentary
The S&P 500 Index has closed below its 200-day moving average for eight straight sessions (as of 3/30)—the worst since the 43-day stretch following the tariff announcements in March-May 2025. Last week marked the fifth straight weekly loss—the worst since 2022. It now seems to be struggling to hold support at the 300-day MA. Frank Holmes of US Global Investors pointed out that the 20-day percent price change Z-score (number of standard deviations from the mean) has fallen to two standard deviations below the mean, i.e., extreme oversold territory and a level hit just seven times over the past five years, and each time it soon fully recovered. Of course, this time could be different if the energy infrastructure and supply chains become so severely damaged that they take years to rebuild, which would limit oil supply and keep prices high. But for the moment, it seems about time for at least a bounce to fill gaps in the chart.
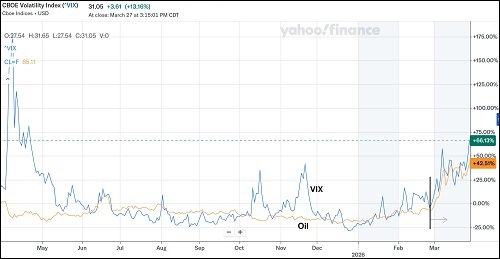
Although the CBOE Volatility Index (VIX) hit a new YTD closing high (31.05) last Friday, the intraday high for the year actually occurred on 3/9, as crude oil (May futures contract) approached $120/bbl, when VIX came close to the 36 handle, which is significant because it marks two standard deviations above its long-term moving average. Such a level has historically been a buy signal. The chart below compares oil price vs. VIX for the past year, reflecting the spike in VIX around the new tariffs last spring, the lack of correlation between oil and VIX through February, and then the sudden correlation following the attack on Iran and the subsequent disruption to oil shipments, as 20% of global supply passes through the Strait of Hormuz.
Energy has been the main sector to benefit from the Iran war and global chaos, with a YTD return of +40%. Major oil companies like Chevron (CVX), Exxon (XOM), and Marathon Petroleum (MPC) have surged to new all-time highs. Of course, the spike in oil price is a major driver, but there has been rotation into Energy all year, even before the attack on Iran. Notably, the forward P/E for Exxon is 20x for 22% projected EPS growth, and Chevron is 23x for 24% growth, which is roughly 1.0 forward PEG ratio. Compare those numbers to AI powerhouse NVIDIA at 20x for 74% growth, or a forward PEG of 0.30. Does that seem off base? Well, according to DataTrek, “Structurally higher Energy valuations are at least partly due to investors consciously choosing a sector with historically strong capital discipline. For example, the top US Energy names will pay out an average of +50% of their 2026 earnings in the form of dividends. Tech, which is investing heavily in AI, will pay out just 11%.” So, the capex is promising for Tech, but the future payoff is uncertain, while high-quality oil companies are returning a lot of cash flow to shareholders.
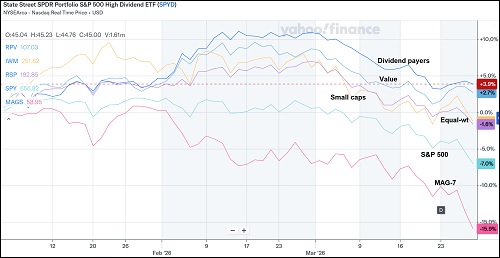
Small caps, value, equal-weight S&P 500, and dividend payers have held up relatively well, both last week and YTD, as the cap-weighted indexes are dragged down by the mega-caps and MAG-7. The YTD relative performance among these market segments is shown in the chart below. Top-performing sectors include high-flying Energy (of course), semiconductors, aerospace & defense, suborbital space infrastructure (as Artemis II launches), datacenter infrastructure and construction, and select Healthcare segments. According to DataTrek, “Capital is moving away from stocks with high valuations and business models with perceived AI risk, and toward companies with more visible cash flows, harder assets, and/or direct exposure to AI infrastructure. Semis are the picks & shovels underpinning the buildout, with sizable order backlogs, while software’s traditionally stable recurring revenues now face disruption risk.”
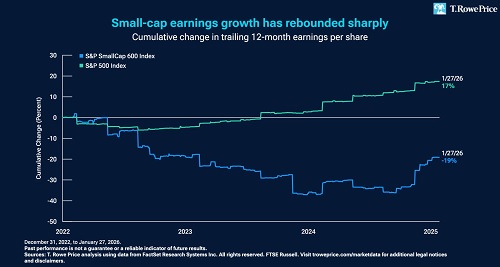
Small caps have held up given their domestic focus, despite the run-up in yields. M&A has been a key catalyst for small caps, as access to capital improves, and corporate management teams are encouraged by witnessing the other deals occurring. Continued strength in the economy and a resumption in falling interest rates will be key. The chart below from T. Rowe Price illustrates the burgeoning small cap renaissance based on changes in trailing 12-month EPS.
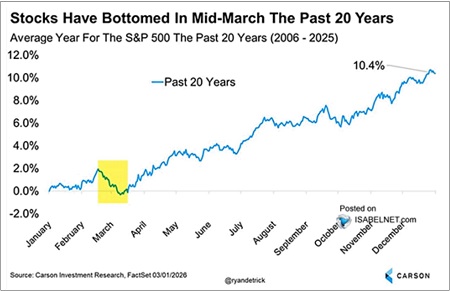
Notably, Real Investment Advice pointed out that stocks have historically tended to bottom in mid-March, as illustrated in the encouraging chart below showing a composite of the “average year” of S&P 500 performance over the past 20 years. Of course, 2026 is hardly an average year.
As mentioned earlier, bonds and equities have both sold off hard. Rising inflation expectations are also lifting the equity risk premium, which suppresses stock valuation multiples and lifts bond premiums—specifically the inflation risk premium, term premium, and credit spreads (default risk). DataTrek observed, “US stock/bond prices have been positively correlated in the 2020s, a major change from the 2010s. Uncertainty about inflation is the primary cause of this shift. Stocks worry about a central bank that could overtighten, pushing the US economy into recession. Bonds worry about inflation remaining elevated or moving higher…. Going forward, we expect Gen AI to be a deflationary technology, with stock/bond correlations returning to negative over the rest of the decade.”
However, gold officially entered a bear market when it fell 20% below its 1/28 all-time high. Although war typically sends investors into safe havens like gold, this time is a bit different as surging oil prices have reignited inflation concerns (since energy prices trickle throughout the economy in various ways, including feedstock and transport costs), and rising inflation (in tandem with rising real bond yields) tend to make gold less attractive (since it doesn’t pay a yield—particularly given the lofty valuation perch it had already achieved. Also, because of reduced odds of near-term Fed rate cuts, leading to a stronger dollar, gold is suddenly less appealing as a dollar debasement hedge.
As the good folks at Real Investment Advice observed, “When you have a lot of positioning [in gold] that becomes offside due to a momentum chase, all it takes is an ‘event’ of some kind to cause a reversal. Military operations in Iran certainly qualify as a reason to seek the safety of the US Dollar. It’s a widely held opinion that precious metals are a safe-haven asset in times of geopolitical stress. However, that is not the case today. The explanation lies in the dollar. When investors become risk-averse, global investors instinctively move into US dollar-denominated assets, resulting in a surge in dollar demand. Accordingly, a stronger dollar makes gold more expensive for foreign buyers, directly suppressing demand and pushing prices lower even as headlines suggest the opposite should be happening…. Simply put…the dollar, not gold or silver, is thus far the preferred panic button in this conflict.”
Eric Peters of One River Asset Management opined, “…gold prices are down 15% since the war started, which is the opposite of what the consensus expected. This tells us a bit about the magnitude of wealth destruction wrought across the global economy…. Productive capacity is being destroyed at scale while nations are desperately racing to rebuild redundant infrastructure for national security reasons. This unusual combination lifts the demand for capital at precisely the time when it is being destroyed. And unlike any crisis of the past fifty years when excess global productive capacity has been ample, fiscal expansion and quantitative easing in today’s capacity-constrained world will not really solve the problem. It will simply lift inflation.” I agree in concept with that last sentence, but I think there is room for modest rate cuts to offset the tax-like impact of gas prices on consumer spending and stave off recession.
Looking overseas, China is struggling mightily to maintain its target growth rate, as captured in this article by Daniel Lacalle. Industrial overcapacity, slowing capacity utilization, weak domestic consumer demand, a housing crisis (again, from overcapacity and weak demand), sluggish private demand for credit, and overreliance on rapidly rising government debt, which is surging the debt to GDP ratio. The lone bright spot is its advancing Tech sector. According to Lacalle, China is expected to set a GDP growth target around 5%. Q4 GDP growth slowed to 4.5% YoY, the worst in three years, and manufacturing PMI has been mixed. The 1-year loan prime rate (the PBoC’s most closely watched benchmark interest rate) sits at 3.0%.
On the other hand, India looks good, particularly given the new tariff regime with the US that was cut from 50% to just 18%, lighting a fire under Indian equities. Projected GDP growth is 7.4% for FY2026 based on resilient domestic consumer demand and recovery in manufacturing. The RBI benchmark interest rate is 5.25% after multiple cuts last year.
As for Russia, it is selling gold and cajoling its wealthy oligarchs to inject money into the economy. Iran was a key trading partner for military equipment and drones, but no longer. Other client states like Venezuela, Cuba, and Syria also out of the picture now, and India has curtailed trade with Russia in response to US pressure, sanctions, and incentives. That pretty much leaves only struggling China as a major trading partner for the once mighty Bear.
Whether the broad indexes finish solidly positive this year may depend upon: 1) liquidity growth, 2) the relative strength of the dollar, 3) the steepness of the yield curve (could the 2-10 spread rise above 100 bps?), 4) the status and outlook on capex for AI and onshoring, and 5) the midterm elections and whether Republicans retain the House.
According to economist and liquidity expert Michael Howell of CrossBorder Capital, this stage of the liquidity cycle (slowing liquidity growth) is correlated with falling bond term premia and a flattening yield curve—which means Treasury notes and bonds may perform well later in the year. Indeed, given where we are with stability in real interest rates and inflation expectations, including the many disinflationary trends—like AI, automation, rising productivity, falling shelter and energy costs, peace deals (fingers crossed), a firmer dollar, and the deflationary impulse from a struggling China—bonds seem ready to return to their historical role as a portfolio diversifier.
The robust Tech sector:
Politically speaking, particularly heading into the midterms, public pushback is growing regarding two key issues that impact average Americans: 1) job losses (you’ve seen the layoff announcements, with recent college grads seeing rising unemployment) and 2) strain on the power grid (for massive datacenters) leading to rising electricity costs and utility capex for expansion (i.e., costs that must be recouped from customers). This threatens continued hyperscale capex growth.
But capital keeps flowing into building the physical layer (hardware and infrastructure). Both the public and private sectors are investing huge capex into the AI supply chain. The five biggest hyperscalers in the US—Meta, Amazon, Microsoft, Alphabet, and Oracle—are on track to spend $710 billion in capex in 2026. And our federal government is investing $500 billion in Project Stargate with OpenAI to develop datacenters and $320 million in Genesis Mission to apply AI in developing energy resources to power massive datacenters, including deregulation, fast-track domestic chip manufacturing, and subsidies for the extensive networking infrastructure.
I have addressed in a previous post the worries about ROI on the massive capex spend and how the concerns might be valid but likely overblown. Certainly, equity investors in hyperscalers are growing increasingly concerned about rising use of debt rather than cash flow to fund the massive capex programs. Oracle in particular has surged its debt/equity ratio (D/E) to nearly 4.7x, although the other hyperscalers still have minimal D/E ratios of 0.3x or less, which should calm investor concerns even as debt funding for the AI buildout expands a bit. It seems there is plenty of room for debt expansion in these names, particularly given their massive cash flows for servicing debt.
Moreover, some commentators believe today’s surging oil prices could derail the AI boom, which is so dependent upon affordable energy. According to a recent article in Reuters, “Historically, a 10% rise in energy prices cuts productivity by about 1%, as new investment becomes unprofitable.” Furthermore, as the dominos fall, “The debt portion of those [massive capital] expenditures, which is rising fast, will get more expensive if central banks hike interest rates to tame rising prices.” And then there is the struggling private credit industry, which will worsen if those marginal debtors don’t see the revenues they anticipated or if their interest expense rises.
Regardless, the models are progressing rapidly and generating real ROI. This year’s Consumer Electronics Show (CES) in Las Vegas in January showcased the way companies from various sectors intend to employ automation and robotics in their new products, such as fully autonomous machines (aka Level 4 Autonomy)—for example, Caterpillar’s (CAT) fleet of autonomous mining machines, developed in partnership with NVIDIA.
Despite the extreme weakness in the software industry due to worries that AI will upend all current enterprise SaaS, NVIDIA’s CEO Jensen Huang does not believe AI agents will replace the enterprise software industry but instead will employ those popular software tools, creating enhanced efficiency. As economist Mohamed El-Erian of Allianz has opined, the prevailing corporate mindset today views AI primarily as a “cost minimizer” whereas the bigger potential is as a “labor enhancer” and “productivity enabler.” We may be witnessing a once-in-a-generation tech-driven productivity boom that promises to suppress inflation, raise growth rates, and provide mouthwatering ROI.
And yet so many naysayers, much like with the personal computer, Internet, and mobile devices, persist in downplaying the enormous potential of Generative AI—why it will fail, how it is underdelivering on its promises, what a waste of resources and capital it has been—but it just keeps progressing. Indeed, the optimists believe we might be witnessing “The Singularity” developing right before our eyes, i.e., when the AI technology reaches a level in which it is able to develop itself in a self-improvement loop, surpassing human intelligence and changing civilization as we know it. Exciting and frightening at the same time.
Furthermore, despite investor worries about overspending on the datacenter buildout, companies like Marvell (MRVL) have released earnings reports reaffirming that AI infrastructure spending continues unabated, with strong demand for high-speed optical connectivity. The companies building the AI compute stack are not dissuaded by any of the onerous macro issues we are facing. As CEO Matt Murphy said at the end of the earnings call, “Look at our outlook for next year. Do you see me blinking? You don’t.”
As Elon Musk gushed, “In 36 months, but probably closer to 30 months, the most economically compelling place to put AI will be space. It will then get ridiculously better to be in space,” where solar panels are much more efficient due to continuous sunlight and no atmospheric filtering. Indeed, SpaceX has filed with the FCC for a million-satellite constellation of solar-powered orbital datacenters without our terrestrial power grid constraints.
And then we have the leaked information about Anthropic’s next-generation Claude Mythos, described as a “step change” in AI performance and providing proof that the hyperscalers’ capex in AI infrastructure (compute, memory, connectivity, and cloud) appears to be paying off.
However, the biggest bottlenecks may be AI’s insatiable and rapidly growing need for power and a shortage of skilled construction labor to build out the critical infrastructure. In a WSJ interview, former Energy Secretary Rick Perry cited the skilled labor shortage mainly in HVAC, electrical, and carpentry, estimating a deficit of 400,000 skilled workers. The asset-light disruption promised by AI can’t manifest without first building out the massive asset-heavy infrastructure. In other words, the construction boom must precede the AI/digital boom. This is where the friction comes in. Costs, critical materials, skilled labor, regulation.
Thus, the unglamorous engineering & construction companies have been garnering much investor attention, as these firms have rising demand and backlogs—and thus, tremendous negotiating leverage. Firms like Comfort Systems (FIX), MasTec (MTZ), Sterling Infrastructure (STRL), and Everus Construction (ECG) have seen record-setting profitability and share prices. As Microsoft CEO Satya Nadella lamented, “It’s not a supply issue of chips; it’s actually the fact that I don’t have warm shelves to plug into.”
So, as DataTrek opined, “S&P 500 returns over the next decade are partially contingent on the likes of OpenAI and SpaceX going public within the next 2 years. Keeping the IPO window open will require decent Tech sector performance, low volatility, and US Big Tech proving their AI investments will pay off.”
The economy, jobs, and productivity:
As a refresher, under President Biden, the federal government passed the Infrastructure Investment and Jobs Act in 2021, followed by the Inflation Reduction Act and CHIPS Act in 2022. Under President Trump, the federal government has taken equity stakes in Lithium Americas (LAC), MP Materials (MP), Vulcan Materials (VMC), Intel (INTC), US Steel [owned by Nippon Steel (NPSCY)], and Westinghouse Electric [owned by Brookfield Renewable (BEP) and Cameco (CCJ)]. And in February, the president announced Project Vault, a $12 billion public-private partnership to create a strategic, physical stockpile of critical minerals and rare earth elements, similar to the Strategic Petroleum Reserve. He has also instituted energy deregulation, manufacturing subsidies, and tax incentives. All of this has sought to incentivize reshoring and re-industrialization for GDP growth, job creation, and national security.
The second estimate of real GDP growth for Q4 2025 was revised down by the BEA to just 0.7%. Recall that back in January, the Atlanta Fed GDPNow model forecasted it as high as 5.4%. For Q1 2026, forward-looking forecasts for real GDP growth have gradually retreated, with the Atlanta Fed GDPNow model estimating 2.0%, as of its 3/23 update. However, because the US is a net exporter of oil and LNG, our trade deficit should fall, which would be positive for GDP. Still, consumer spending is fatiguing, the labor market is slowly weakening, and financial conditions have tightened due to private credit stress and the dollar’s recent appreciation.
Regarding the jobs market, as of February, private payrolls rose an average of 33,000 per month over the past year, driven by health care & social assistance, while manufacturing and retail jobs fell. Recent college graduates are seeing the brunt of the contraction, as choice opportunities are few and far between. This week brings new jobs reports.
Industrial production rose modestly in February for the fourth consecutive month to reach a new post-pandemic high. According to First Trust, it is 2.5% higher since Trump took office in January 2025, despite shifting trade and tariff policy, with the manufacturing sector also up 2.6% over the same timeframe. Not surprisingly, production of high-tech equipment increased 8.6% over the past year, and business equipment manufacturing increased 6.3%. Both are reflective of the strategic move towards reshoring and re-industrialization. We shall soon see what the March metrics show.
The latest report (Q3 2025) on US productivity growth showed average at a +1.8% annualized rate, which essentially normalized back to the 2% trend. This followed impressive acceleration of +4.9% in Q3 2025, which was the fastest in two years, and +4.1% in Q2 2025. For full-year 2025, productivity rose +2.1%, +2.3% in 2024, and +2.7% in 2023), suggesting a promising long-term trend driven by AI adoption and aggressive business actions to improve efficiencies and profitability. AI promises to push sustained productivity levels to the 2.5-3.5% range, which would mean significant upside in earnings, margins, wages, and non-inflationary GDP growth. As famed economist Ed Yardeni likes to say, “Productivity is like fairy dust. It makes everything better.”
Inflation turns back up:
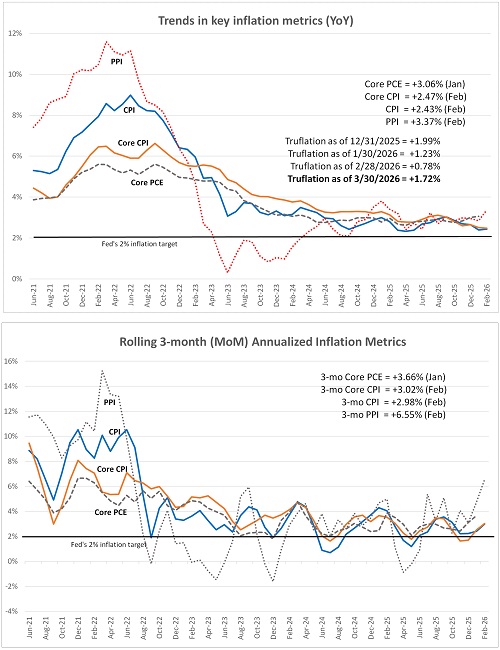
Next week begins the much-anticipated March inflation reports. But for February, PPI was distressing, rising +0.7% MoM and +3.37% YoY. However, the increase has been led by the services sector, not the goods sector, as goods prices rose +2.5% YoY while services prices rose +3.8%. This contradicts the prevailing narrative around tariffs. As I have often stated, tariffs act like a tax, which suppresses consumer demand (in the absence of a commensurate rise in personal income).
February CPI surprised by holding steady at +2.43% YoY and Core CPI at +2.47% YoY. Both readings are at or near their lowest YoY pace in five years (before the pandemic inflationary surge). Shelter continues to be the main driver of core inflation, but the lag time is finally reflecting the falling rents evident in other data, with rents rising at a +2.4% annualized rate. Airfares and hotel rates also rose. Of course, oil and commodities are their own story.
The upper chart below compares the headline YoY inflation numbers for PPI, CPI, Core CPI, and Core PCE, but I also like to look at the annualized 3-month rolling averages to get a better sense of the current trend, as shown in the lower chart. Both charts show that after returning to some semblance of normalcy (near 2%), the current trend has turned back up (for now). The most recent of the metrics is February (for all but PCE), which shows 3-month rolling annualized trend of +2.98% for CPI and +3.02% for Core CPI, which reflect upward price resets in services early in each year that annualize at higher levels. It is evident that PPI tends to be more volatile month-to-month, with a 3-mo annualized trend surging to +6.55%!
Notably, the falling quarterly New Tenant Rent index is finally showing up in long-lagged CPI shelter cost (3-quarter lag), as I discussed in my January post. It only measures recently signed rental agreements, so it is a better indicator of the current trend in rental prices than the All Tenant Rents Index. So, CPI shelter, which accounts for 35% of CPI, should continue to trend lower and help contain both CPI and Core CPI (excluding food & energy).
For March, the Cleveland Fed Inflation Nowcast predicts CPI of +3.16%, Core CPI of +2.60%, PCE of +3.23%, and Core PCE of +2.97%, as of 3/30. Another metric I follow is the real-time, blockchain based "Truflation” metric, which is updated daily based on 30 million data points and tends to presage CPI by several months. It is much better at reflecting current housing costs than CPI or PCE. As of 12/31/25 it had fallen to +1.99% YoY (vs. +2.65% for CPI); as of 1/30/26 it fell to +1.23% (vs. +2.39% for CPI); as of 2/28/26 it fell further to +0.78% (vs. +2.43% for CPI); and as of 3/30/26 it shows +1.72% as war-disrupted supply chains have driven up prices.
In addition, the New York Fed’s Global Supply Chain Pressure Index is a Z-score (the number of standard deviations from the mean) that seems to be settling in around the zero line (its historical average). For February, it sits at 0.49 standard deviations from the mean, so still well within the normal range. GSCPI tends to presage PPI, which although more volatile, tends to presage CPI. So, low supply chain pressures suggest moderating PPI which suggests moderating CPI, and indeed CPI had been gradually receding over the past three years—at least until the Iran conflict. The March reading comes out early next week.
War is inflationary primarily because it creates severe supply chain disruptions, raises energy and raw material costs, and forces governments to dramatically increase spending—often financed by borrowing or printing money—which boosts demand while goods are scarce. This combination of rising production costs and high consumer demand creates a "shock" that drives up prices. Rising inflation can undermine investment, weigh on private consumption, and threaten macroeconomic stability.
Of course, oil prices and their impact on inflation and economic growth are dominating the news cycle. The prevailing view is that the war-driven spike in oil prices will cause inflation to surge. But as James Rogan opined, “Iran’s economy is in tatters. Iran needs to export its oil through the strait to obtain the hard currency necessary for critical imports. If Iran tries to close the strait, it will be committing economic suicide. The Iranian regime wants to survive.”
Kevin Rich of WEBs Investments noted, “Markets are no longer pricing in a clean disinflation story or multiple rate cuts this year.” Still, I’m sticking to my guns with my falling inflation thesis. Once the smoke clears on the Iran war and assuming Kharg Island and its oil export capability survives, I expect a resumption in the many secular disinflationary trends, such as the buildout and implementation of Gen AI, automation, and robotics; rising productivity; falling shelter and energy costs; peace deals (war is inflationary, so peace is the opposite); the deflation impulse on the world from China (due to its domestic struggles and falling consumer demand); increased domestic productive capacity (i.e., “duplicative excess capacity,” in the words of Treasury Secretary Scott Bessent); and the firmer dollar (safe haven).
Like a new tariff, an oil price spike acts like a tax on consumers, and taxes are inherently deflationary (without a commensurate increase in personal income to offset it) as they reduce disposable household income and consumer demand. As a result, many corporations and businesses see weakening demand for their products, which tends to push prices lower elsewhere in the economy. In other words, while gasoline may temporarily boost headline CPI, it simultaneously suppresses price pressures throughout much of the consumer economy.
As respected economist Ed Yardeni observed, “The US economy now requires significantly less energy per unit of GDP than in earlier decades, reflecting efficiency gains and a shift away from manufacturing toward services (chart). As a result, oil price spikes are less inflationary and do less damage to real economic activity than in the past when energy intensity was much higher.”
Fed policy:
Of course, the FOMC is trying to find a balance between the stagnant jobs market and sticky inflation, while also considering the impact on rising federal debt service of higher interest rates. As of 3/30, CME Group fed funds futures give a 20% chance of a 25-bp cut by year end and a 5% chance of at least one rate hike. But this has been quite a moving target as the daily news can quickly shift the odds dramatically, even intraday. At one point last week, there was a 25% chance of a rate hike! Given the current situation in Iran, I don’t expect falling inflation prints, at least until the hostilities end, but I don’t expect a big surge in inflation either—and I certainly do not agree with the suggestion to hike rates.
Why not hike rates to “fight inflation”? Petroleum is embedded across the economy, so higher oil price means higher CPI. But while higher oil prices displace other discretionary spending (as discussed in the previous section), it can be partially mitigated with looser monetary policy. Instead, the knee-jerk reaction to rising CPI, no matter the causes, is to raise rates, which would create a dangerously recessionary duo of higher oil price coupled with higher interest rates.
The Natixis team wrote, “When inflation is driven by supply constraints, rather than excess demand, the objective should not be limited to reducing inflation as quickly as possible. It should be to minimize total economic damage over time, taking into account both the intensity and duration of the shock. Monetary policy is designed to manage demand. When inflation arises from excess demand, the prescription is clear—hike rates. But when inflation arises from supply shocks (today’s Iran Conflict, COVID, or the Russia/Ukraine war), the problem changes but the tool does not. The Fed’s dual mandate complicates policymaking because the two targets of the mandate can come into tension at times. Like today, for example, hiking interest rates to arrest inflation worries could very well exacerbate a labor market that is already slowing and potentially tip the economy into recession, which would exacerbate full employment goals.”
First Trust economist Brian Wesbury opined, “Yes, inflation is still above the Fed’s 2.0% target. However, monetary policy has been relatively tight the past few years after the massive surge in the money supply in 2020-21. In the ten years prior to COVID, the M2 measure of money grew about 6.0% per year with inflation averaging at or below 2.0%. In the past year, M2 is up just 4.3%. The Fed is not too loose right now, which is why chatter about the next rate move being a hike doesn’t make sense.”
And Jai Kedia of the Cato Institute wrote, “Supply shocks, such as unexpected oil price surges, are uniquely difficult for central banks. Unlike demand shocks, in which inflation and output move in the same direction and the recommended policy response is to lean in the other direction, supply shocks force a trade-off. Tighten too much to contain inflation, and you risk compounding the damage from reduced output. Ease too much to cushion growth, and you risk embedding the price spike into longer-run expectations. Hold steady, and you are implicitly betting that the two effects will offset each other…. The Fed cannot fix bad foreign policy, trade policy, or fiscal policy. At best, it can respond in a consistent and predictable manner to keep markets and expectations anchored. Rules-based monetary is the way to do that.”
Notably, the 10-year Treasury yield has surged from about 4.0% at the beginning of March to around 4.3% on 3/30, while the 30-year mortgage rate has risen from below 6.0% to about 6.4% as of 3/26, according to Freddie Mac. The 10-2 spread (and term premium) had been climbing pretty steadily since its July 2023 low of -108 bps but seems to have peaked on 2/9 at +74 bps. Since then, it fell steadily to +46 bps on 3/26 but then jumped to 56 bps on 3/27. As a reminder, a falling term premium indicates that investors demand less compensation for holding long-term bonds, so apparently the surge in rates across the yield curve is viewed by investors as a short-term issue so they are starting to buy the longer-dated notes and bonds. In contrast, a rising term premium reflects investor concerns about rising debt and deficits, as well as anger from the “bond vigilantes,” i.e., activist institutional investors and hedge funds who are protesting fiscal irresponsibility and/or don’t think the Fed should be cutting.
The dollar tends to get stronger in foreign exchange markets when: 1) US economic growth outpaces other developed markets, 2) the Fed tightens policy by pausing rate cuts, or 3) geopolitical concerns drive global investors into the safety of the US dollar and Treasuries. Well, we know which of these has been the current driver of the stronger dollar. Sectors that benefit are those that have relatively limited forex risk, like domestically focused small caps and value stocks (such as industrials and energy services companies) rather than large multinationals. Also, the major goods importers (like retailers and distributors) have increased purchasing power, which lowers their import costs and improves margins.
The firmer dollar also tightens financial conditions by slowing liquidity growth (as other currencies buy few dollars), which inhibits global economic growth potential. But this has been partially offset by rising velocity of money (transactions per dollar in circulation, which is market driven). Velocity has steadily risen over the past four years, through Q4 2025. The Q1 2026 estimate of M2V velocity is due out soon. If the Fed keeps liquidity too tight, it constrains GDP growth and consumer demand. Aligning money supply growth with economic growth leads to price stability and efficient capital allocation.
Also, the US has benefited from foreign capital flight, the majority of which does not show up in our M2 money supply thus creating “shadow liquidity” that has helped inflate our capital markets—albeit at the expense of the rest of world (ROW). As inflation eases and central banks cut interest rates, the US and India (the world’s fastest growing major economy) continue to drive global economic activity while Europe and China (among others) struggle to reinvigorate growth.


Comments
Log in or sign up to join the conversation.