
(Click on image to enlarge)

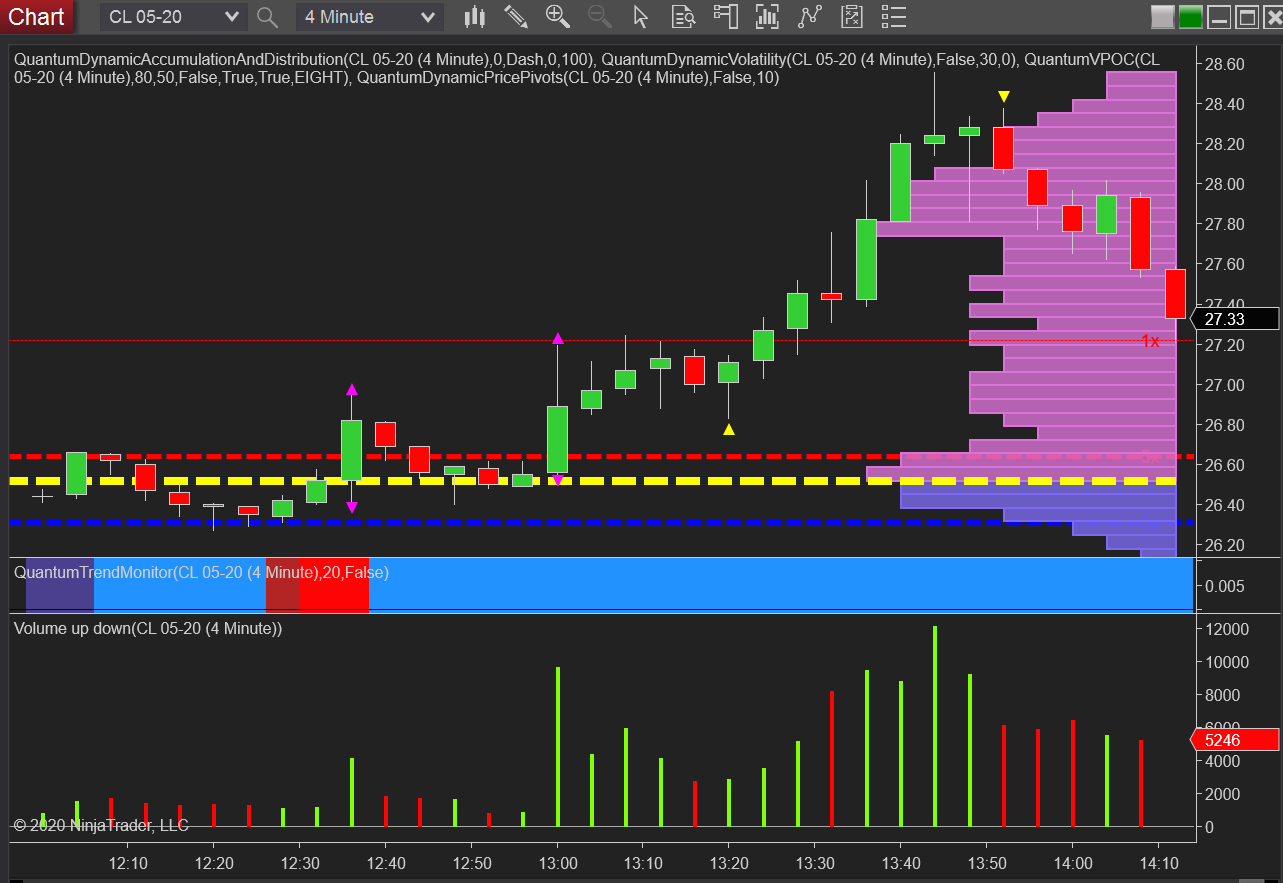
A classic example of price and volume in agreement over several candles rather than one, on the 4 minute chart for the WTI oil futures. First is the congestion phase, then higher volume signals the break. This is followed by rising volume and rising price, confirming the strength of the move higher until finally we see heavy selling on the deep wick candle at the top and the market weakness. And as you might expect, this is also helping to drive some of the Canadian dollar pairs.
(Click on image to enlarge)
And here is the same chart a few minutes later.

Comments
Log in or sign up to join the conversation.