

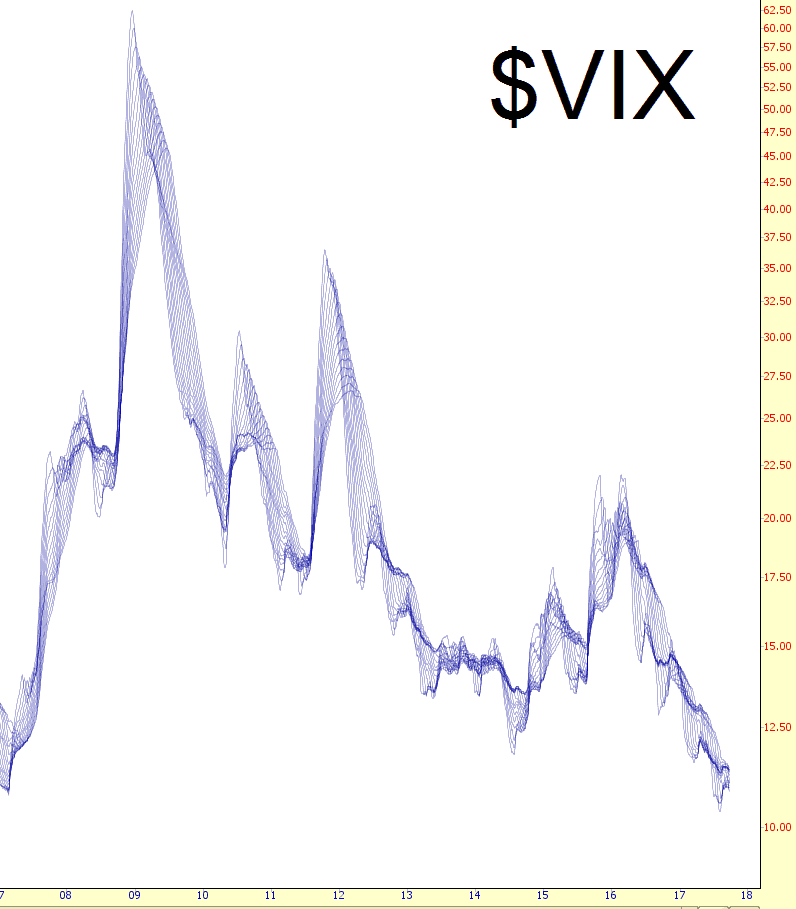
One of my favorite studies is one that isn’t seen much, and it’s called a ribbon study. It’s the application of a large quantity of moving averages (sixteen, I think) that are relatively close in periodicity, thus forming a ribbon-like structure around the price that twists and turns. It tends to get denser (and darker) at inflection points (or at least points of inactivity).
I applied it to the VIX, as shown below, hiding the price data itself and showing only the study. I’m not going to pretend any great insight leaped out of this chart, but maybe it will for you. If nothing else, it’s real purty.
(Click on image to enlarge)


Comments
Log in or sign up to join the conversation.