
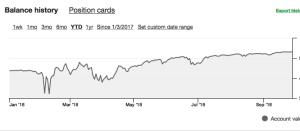
Coming out of a surprisingly strong 3rd Quarter for equities, many fund managers are in “catch-up” mode. The hope is that the 3rd Quarter’s outperformance will be dialed back a little bit and before the height of earnings season commences. As I've been offering all year long to Finom Group (for whom I am employed) subscribers, the market should trend higher and express the strength in corporate earnings, derived from the underlying strength in the economy. Additionally, I expected the markets to express a lack of volatility post the February "Volmageddon" period that found the VIX spiking more than 100% in a single day. Based on the plan I had for the Golden Capital Portfolio (for which I manage all investing capital) in 2018, the portfolio is up sharply on the year and since employing a short-VOL strategy that I'm best known for. (See brokerage account balance chart below)
Last week was rather uneventful for the markets, as the week got off to a poor start and attempted a rally post the Fed’s .25 bps rate hike on Wednesday. As investors look forward to the final quarter of the year, let’s briefly summarize the major indices’ performance for the 3rd Quarter. For the quarter, the S&P 500 rose 7.2%, its best quarterly gain since the fourth quarter of 2013. The Nasdaq also notched a 7.1% quarterly gain, its best since first quarter 2017. The Dow Jones Industrial Average outperformed its peers in the third quarter, rising 9.3 percent.
S&P 500 Performance & VIX
The S&P 500 has risen for 6 straight months, which is historically a bullish signal that forward returns are still yet to come. The following table from Troy Bombardia indicates previous instances whereby the S&P 500 rose greater than 7% in the 3rd Quarter. History does indeed denote continued gains in the forward-looking 12-month period.

With regards to what we could expect from the market this coming week, SPX options depicts an expected weekly move of roughly $34, slightly more than the prior two weeks. Since April 1st, 90% of the time we are seeing the SPX inside of the standard deviation, last week being no exception, having only breached the weekly expected move 3 times since April 1st. As a measure of how things have calmed down of late, the S&P 500 had 36 sessions where it ended with a 1% move in either direction in the first half of the year. So far in the second half, it has had zero.
The S&P 500 has gone 66 trading days without a move of 1% in either direction. “Going back to 1990, only 1993, 1995 and 2017 had longer streaks without a 1% daily change, according to Ryan Detrick of LPL Financial.”

Speaking on the subject of "1% market moves lacking" or volatility, the VIX is a stochastic process that defines a level of complacency or fear at any given moment in the market. The VIX is priced from a portfolio of S&P 500 (SPX) options defined by the CBOE, and the futures price from the market’s expectation (Implied Volatility) of where the VIX Index will settle at expiration. One component in the price of SPX options is an estimate of how volatile the S&P 500 will be between now and the option’s expiration date. As such, VIX is not just a stochastic process that defines volatility, it is a derivative. Furthermore and given the aforementioned characteristics, forecasting and charting the VIX are futile efforts that lack efficacy based on the aforementioned.
When some market participant offers a forecast for the VIX based on a measure of technical analysis, understand the effort to be one that lacks understanding and possibly injects personal bias. The VIX has had some back and forth action over the last 30 days, finding support around 11, but failing to break back below this level as it had done so in August. The support has come even as the S&P 500 has achieved new all-time highs, bringing about some level of divergence in the historic correlation between the VIX and S&P 500. Traditionally, the VIX moves inversely to the S&P 500. Having said that, there have been times where the VIX and S&P move together. The attention is more so directed at the VIX when it moves up in accordance with a move higher in the S&P 500. Typically this leads many to mischaracterize the move as a warning signal. In truth, it can be seen as such and as it has in the most recent February 2018 period. But there is much more to the warning than the VIX and S&P 500 moving higher together to compile a true warning flag for investors.
Back in late August Dana Lyons, a partner J. Lyons Fund Management Inc., warned investors as the VIX was diverging from its normal, inverse S&P 500 correlation. Lyons pointed out that the S&P 500 closed at a record on Aug. 21, but the VIX ended at more than 40% above its 52-week closing low of 9.14 from November. To support a cyclical bear market thesis based on the decoupling of the VIX-SPX relationship, Lyons offered the following chart and sentiment.

“It depends greatly on what type of market environment we are in: an unfettered secular bull market or one still at risk of serious cyclical bear markets. For what it is worth, we are in the latter camp,” he said.
To be clear, the offering from Dana Lyons was not technical analysis but historical, statistical analysis. In reviewing the analysis offered by Lyons, Finom Group (for who I am employed) refuted the analysis in an article titled When the S&P 500 and VIX Share Trading Trajectory? In the article, Finom Group states the following:
“While Dana Lyons is of the opinion that equities are ripe for a pending bear market cycle, Finom Group believes the current bull market cycle will have legs to grow into 2019 and see future S&P 500 record levels in 2019. Earnings growth is simply too robust and forward-looking earnings are still expected to grow in the double-digit range in early 2019.”
There has been no “sell in May and go away”. The recent decoupling of the VIX’s inverse correlation to the S&P 500 didn’t pan out as the statistical data may have had one assume. Nonetheless, Dana Lyons chose to update his prior findings on September 22nd and in an article titled VIX Volatility Divergence Sends Mixed Message To Stock Market. Here is what Lyons offers in his recent article and analysis:
Specifically, the S&P 500 rose by more than 0.75% to a new 52-week high. Yet, at the same time, the VIX closed nearly 30% off of its 52-week low — and up on the day. As in the case of the divergence in our previous post, precedents were few and far between in the past 18 years. In fact, the only days meeting similar criteria since 1999 were the following:
- 3/23/2000
- 4/25/2007
- 1/17/2018
- 8/27/2018
- 9/20/2018
As we can identify from the dates where the occurrence in question takes place for the 2018 period, obviously we can draw the conclusion that January 17, 2018 didn’t mark a top for the market, nor did it do so on August 27, 2018. Given Lyons past analysis, which was found in error near-term, he decided to go further back in time and perform some additional due diligence on the statistical data whereby the VIX-SPX inverse correlation decoupled. (See chart below)

As depicted in the chart above from Lyons, if we extend the chart back prior to the past few decades, and back to the beginning of the VIX in 1986, we find several more, less threatening breakdowns in the VIX-SPX relationship. Be careful out there when attempting to time the market based on the VIX-SPX relationship; it can often prove just as faulty as it can prove accurate.
Economic Data Trumps Global Trade Spats
With global trade tussles still abound, several firms and analysts have reduced their expectations/forecast for Q3 GDP. While all the reported Q3 forecast adjustments and commentary from retailers and ratings agencies seems dire with respect to tariffs, to a great extent they are discounting current readings of consumer sentiment. The final reading of the University of Michigan’s consumer-sentiment index in September was 100.1, above August’s level of 96.2.

Readings of current economic conditions and the consumer expectations were slightly down from preliminary readings but up sharply from August. Expectations for improved personal finances are at the highest level since 2004. Inflation expectations also declined. The only negative cloud on the horizon was concern about trade tariffs, the University of Michigan said.
Moreover, while consumer sentiment is high, consumer spending is not quite as high. Consumer spending moderated in August after five straight strong gains. Consumer spending rose 0.3%, the slowest pace since February, the government said Friday.

The 12-month increase in the PCE index fell to 2.2% from 2.3 percent as reported last week for the month of August. The yearly increase in the core PCE rate that strips out food and energy was steady at 2 percent.
Investors, analysts and economist will get their first look at the labor market this coming Friday when Nonfarm Payrolls are to be reported. Economists polled by MarketWatch forecast a total of 168,000 jobs were created in the month of September. The jobs data could go a long way to reinforcing the S&P 500’s performance heading into the height of earnings season in the weeks to come. Here is how CNBC’s Jim Cramer views the forthcoming Nonfarm Payroll report.

"Things are tricky" with the jobs report: If it's weaker than expected, concerns will arise that the Fed is raising rates in an already-cooling economy. If it's stronger than anticipated, there will be calls for more rate hikes.
It's the most worrisome part of every tightening cycle. I think the Fed's doing a great job and I think we're going to get a Goldilocks number, one that's strong enough to refute the slowdown story but weak enough in terms of higher wages to withstand the inflation narrative.
All things considered, Friday's report will really be the make-or-break number for the market next week. As we enter the first week of the fourth quarter, Friday's labor report is by far the most important number, and if it doesn't come in just right, like it's been for ages, then you've got to be ready for a bit of a sell-off, because after this strong quarter, we might as well be set up for one," he told investors.”
S&P 500 Q3 Earnings Forecast
Earnings drive markets over time and to date, earnings have been extremely strong through the first half of the year at roughly 25% YOY growth. Let’s take a look at what we are forecasting with regards to the Q3 2018 earnings period. We have underestimated earnings growth in both the Q1 and Q2 earnings periods for 2018.
Key Metrics
- Earnings Growth: For Q3 2018, the estimated earnings growth rate for the S&P 500 is 19.3%. If 19.3% is the actual growth rate for the quarter, it will mark the third highest earnings growth since Q1 2011 (19.5%).
- Valuation: The forward 12-month P/E ratio for the S&P 500 is 16.8. This P/E ratio is above the 5-year average (16.3) and above the 10-year average (14.5).
- Earnings Scorecard: For Q3 2018 (with 16 companies in the S&P 500 reporting actual results for the quarter), 14 S&P 500 companies have reported a positive EPS surprise and 10 have reported a positive sales surprise.
- Revenue Growth Rate: The estimated (year-over-year) revenue growth rate for Q3 2018 is 6.9%. Ten of the eleven sectors are expected to report year-over-year growth in revenue. Three sectors are predicted to reported double-digit growth in revenue: Energy, Communication Services, and Real Estate.
Once the calendar year ends, it also marks the peak in the earnings cycle. For Q4 2018, analysts are projecting earnings growth of 17.2% and revenue growth of 5.7 percent. For CY 2018, analysts are projecting earnings growth of 20.3% and revenue growth of 7.6 percent. For Q1 2019, analysts are projecting earnings growth of 7.1% and revenue growth of 6.3 percent. For Q2 2019, analysts are projecting earnings growth of 7.4% and revenue growth of 4.6 percent. For CY 2019, analysts are projecting earnings growth of 10.3% and revenue growth of 5.3 percent. The YOY comparisons alone make for tough sledding come 2019, but earnings are still expected to grow at a respectable pace and barring further escalations in the global trade war. We would simply ask investors to continue to monitor the trade headlines and analysts notes regarding the subject matter, as it may impact forecasts for 2019 and beyond. Now let’s review what Thomson Reuters is forecasting for the Q3 2018 earnings period. Thomson Reuters has also underestimated the previous 2 reporting cycles, but to a lesser extent.
18Q3 Earnings Growth Highlights
- The estimated earnings growth rate for the S&P 500 for 18Q3 is 21.6%. If the energy sector is excluded, the growth rate declines to 18.6%. The S&P 500 expects to see share-weighted earnings of $339.7B in 18Q3, compared to share-weighted earnings of $279.3B (based on the year-ago earnings of the current 505 constituents) in 17Q3.
- The estimated revenue growth rate for the S&P 500 for 18Q2 is 9.5%. If the energy sector is excluded, the growth rate declines to 8.4%.
- For CY 2019, analysts are projecting earnings growth of 10.2% and revenue growth of 5.3 percent.
Comments
Log in or sign up to join the conversation.