
Since the first quarter 2020 earnings reporting will soon get underway the time has come to update our Volatility Kings™ list of companies that have a regular tendency to experience increasing option implied volatility as their quarterly reporting dates approach.
After some subjective editing, this quarter's list includes a few selected tech companies that would not usually be included, but after the recent market decline may offer an opportunity for put sales as their implied volatilities decline. In addition, a few others involved in the battle again the CIVID-19 virus pandemic were included for this special edition.
The degree of uncertainty for upcoming reports may not be comparable to previous quarters. While some companies are on the list one quarter and not the next, others seem to remain on our list quarter after quarter. Since the focus is on earnings, others with high-implied volatility due to takeover speculation, FDA announcements or other extraordinary events, are excluded, along with those lacking sufficient liquidity due to low option volume described below.
In order to focus on those with the best options volume and liquidity, the weekly option volume requirement is set at those with greater than 20K contracts. As a result, some companies are included one quarter but not the next. In addition, when market implied volatility raises more companies will meet the volume threshold. The objective is to find those stocks with sufficient options liquidity and therefore reasonable bid/ask spreads to use for various multiple leg strategies, such as Calendar Spreads, Butterflies, Iron Condors, Straddles and others.
The selection process begins at our daily listing of ![]() found in the Rankers and Scanners section of our home page about one-half way down the page, at the top left. Individual stocks with options volume less than 20K are eliminated along with those with prices less than 10, since when prices are too low there are usually not enough option strike prices or liquidity for attractive option strategies.
found in the Rankers and Scanners section of our home page about one-half way down the page, at the top left. Individual stocks with options volume less than 20K are eliminated along with those with prices less than 10, since when prices are too low there are usually not enough option strike prices or liquidity for attractive option strategies.
Volatility Kings™ 1Q 2020

Descriptions and details for the column headings in the table above:
Price in column 3, are closing stock prices as of April 3, 2020.
When in column 4, shows the next expected earnings report date. They require checking often as these are only estimates and companies often change the dates. Time in column 5, shows the time during the day to expect the report, where B is before the open, A is after close.
Est. or Estimate in column 6 represents the current consensus per share earnings estimate according to Earnings Whispers and may change before the report date. Some may also have higher “whisper” estimates. In addition, stock prices move on forward guidance as much, or perhaps more than on reported revenues and earnings.
Last Q IV in column 7 shows the Implied Volatility Index Mean (IVXM) of the puts and calls reached just before the last quarterly report, but may not necessarily be as relevant this quarter.
IV Min Ex in column 8 shows the Implied Volatility Index Mean (IVXM) low after the last earnings report, making it easier to compare the pre-report high to the subsequent after reporting low.
IV Now in column 9 is the Implied Volatility Index Mean, (IVXM) as of April 3, 2020. Depending upon the last report date the implied volatility of those having recently reported may still be declining, such as Micron Technologies (MU).
52R displays the current Implied Volatility Index Mean (IVXM) relative to the 52-week range, where .79 is above the midpoint for Gilead Sciences (GILD), while near closer to the bottom for JD.com (JD). After the recent market decline and partial rebound, many implied volatilities are close to their 52-week mid-points.
IV Est/Now in column 11 (yellow highlight), shows the ratio of the estimated implied volatility to the current implied volatility based primarily on the high reached the previous quarter. Those with higher ratios have a potentially greater opportunity to increase going into their next report date such as Micron Technologies (MU) at 1.52 and Slack Technology (WORK) at 1.73.
Comments and Observations
Typically implied volatility declines for 4-6 weeks after the reporting date followed by a subsequent rise for about 3-4 weeks before the next report, but vary with each having their own somewhat unique pattern.
In addition, market implied volatility plays a role. The S&P 500 Index implied volatility, measured by our IVolatility Implied Volatility Index Mean (IVXM) using four at-the-money options for each expiration period along with our proprietary technique that includes the delta and vega of each option, declined 15.99 points or -27.55% last week ending at 42.04% after peaking at 77.15% on March 16. However, a return to the mean suggests it still has some distance to go. The charts of many companies in the list above also show significant implied volatility declines from their peaks.

To help identify implied volatility highs, lows, and forecast where they may go, along with other details, make sure to check the volatility charts at either our complimentary Basic Options or our more detailed Historical Data Charts on our website.
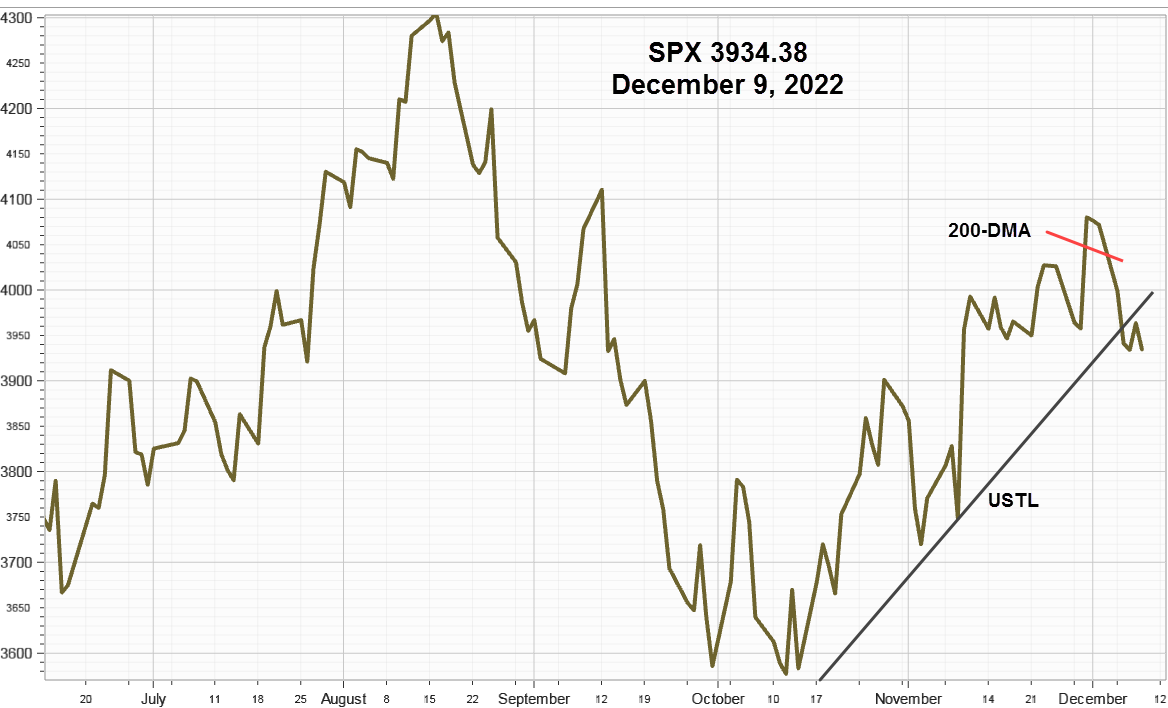
Various options indicators reflect less fear as implied volatility and put volume decline. The Cboe reported the highest total put volume for all underlying issues in this decline at 5.51 million contracts on March 12, compared to 2.79 million last Friday, while the S&P 500 Index reached what appears as an Elliott 3-wave bottom on March 23at 2192.
Earnings Strategy Ideas
Long Calendar Spreads buy deferred month options with lower implied volatility and sell near term options with higher implied volatility with the same strike prices. However, since this position has short gamma or the rate of change of delta, any large move of the underlying stock on the reporting date will result in a loss.
Short Calendar Spreads take a different approach by buying near term options and selling deferred options before the implied volatility of the front-month begins to advance anticipating the next report date. The deferred short option implied volatility is less likely to advance while the implied volatility of near term increases going into the earnings date. Then close the position near the top of the implied volatility just before the earning date. The risk of a harmful stock price gap diminishes by closing the spread before the earnings report release. Two examples to consider for this approach are Micron Technologies (MU) and Slack Technologies (WORK).
Iron Condors sell both out-of-the-money call and put spreads when implied volatility advances significantly, especially when the stock price trades near the middle of its recent range. Even if the stock makes a large move, only one side of the position will be threatened.
Short Puts
Selling cash covered puts or out-of-the-money put spreads offer the opportunity to take advantage of declining implied volatility. Another strategy, often called a risk reversal, uses the proceeds of a put sale to cover or partially cover the cost of a long call spread. However, short puts have assignment risk if the stock prices have not yet bottomed. Some plans may even anticipate assignment as a strategy to acquire quality companies at slightly lower price as they look across the valley. Some examples are Tesla (TSLA), Shopify (SHOP), Microsoft (MSFT) and those involved in the COVID-19 battle like Johnson & Johnson (JNJ) and Gilead Sciences (GILD).
Summary
Since first quarter 2020 earnings reporting will begin soon our modified version of Volatility Kings™ list offers some ideas for various volatility strategies, such as Long or Short Calendar Spreads, Iron Condors, if implied volatility remains abnormally high just before their reporting dates, along with short puts and various short put combinations.
Comments
Log in or sign up to join the conversation.