
New highs for the S&P 500 Index as well as the Dow Jones Industrial Average and many important sectors describes the equity action last week. With just a few exceptions, like VIX correlation shown in the chart below, the lights are green although expect some minor pullbacks along the way accompanied by volatility on China trade agreement news.
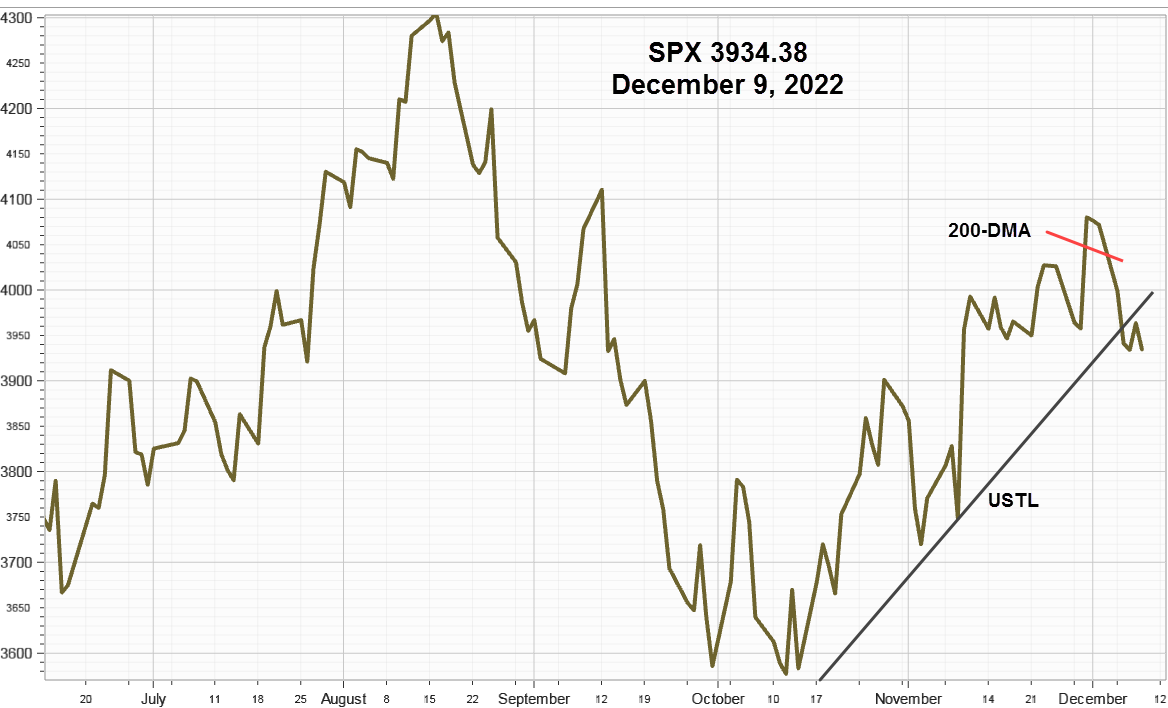
S&P 500 Index (SPX) 3093.08 added another 26.17 points or +.85% last week, closing at another new high and just below the new intraday high of 3097.77 made on Thursday. Now considered overbought by some measures, a pullback to test the breakout should be expected. In the past, the VIX 10-day correlation gave pullback warnings.

Friday the correlation decreased by .31 to -.56 after reaching -.25 Thursday. In late June, the last time the correlation advanced to this level it marked the end of the pullback (light blue vertical line). Warning or already over?
CBOE Volatility Index® (VIX) 12.07declined another .23 points or -1.87% last week. Our similar IVolatility Implied Volatility Index Mean, IVXM using four at-the-money options for each expiration period along with our proprietary technique that includes the delta and vega of each option, declined just .10 points or -1.01% to 9.80% vs. 9.90% for the week ending November 1, shown in the chart below, and now at the lower end of the range.

VIX Futures Premium
The chart below shows as our calculation of Larry McMillan’s day-weighted average between the first and second-month futures contracts.
With seven trading days until November expiration, the day-weighted premium between November and December allocated 28% to November and 72% December for a premium of 28.91% above the bullish green zone.

The premium measures the amount that futures currently trade above or below the cash VIX, (contango or backwardation) until front month futures contract converges with the VIX at expiration on Wednesday, November 20. Typically, a normal upward sloping futures premium curve above VIX by 10% - 20% correlates well with a rising SPX.
For daily updates, follow our end-of-day volume weighted premium version located about halfway down the home page in the Options Data Analysis section on our website.
Strategy
Breakouts to the upside in many important sectors like semiconductors, technology, industrials, materials, health care, and even regional banks along with the Invesco QQQ Trust Nasdaq all reflect impressive upside momentum. Are investment managers sensing the winds of cyclical recovery or being fooled by China trade agreement optimism?
While some market commentary attributes many sector breakouts to the expected China trade agreement, with the benefit of hindsight it now seems the October 11 statement by the Federal Reserve deserves more credit than given in Digest Issue 41 "China Trade & Fed Adds Liquidity [Charts]." In review, the Fed said it will start buying about $60 billion per month in Treasury bills starting Oct 15, to ensure “ample reserves” in the banking system, but emphasized the new program does not mark a change in monetary policy. Some money managers describe it as "non-QE" QE. In addition, they will offer liquidity daily to the overnight bank repo market until January.
With the 10-2 U.S. Treasury Note yield curve at .26 after the 10-year note yield gained 21 bps while the 2-year yield added just 12 bps and with no indication of liquidity concerns, the monetary condition seems accommodative as claimed by two regional Federal Reserve Presidents last week. It seems like the Fed wants to make sure the markets know they have every intension of not making the same mistake they made last year– just what the bulls want to hear.
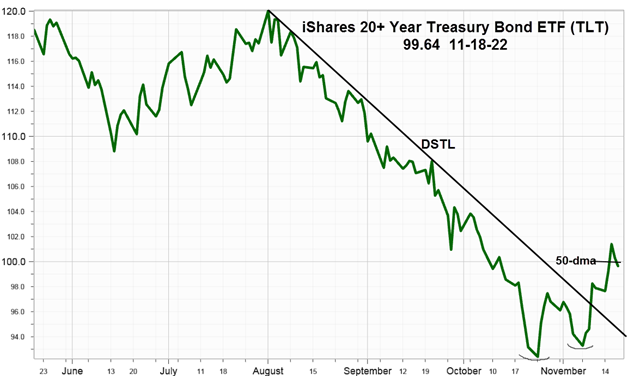
However, a strong U.S. dollar remains a constraint on the bullish outlook. US Dollar Index (DX) 98.20 up 1.16 points or +1.20% last week. Although bond prices declined last week, the dollar gained, suggesting rotation out of bonds into equities.
For now, call the S&P 500 Index trending higher in narrow trading ranges reflecting a growing consensus it will continue. However, be aware of a potential sell the news event on the China trade agreement announcement whenever it comes.
Summary
Although futures and options indicators remain bullish, the VIX correlation increased enough last week to suggest increasing option activity in anticipation of an overdue pullback. In the meanwhile, Federal Reserve actions and commentary remain accommodative and should support the markets though the end of the year, assuming no surprises.
Comments
Log in or sign up to join the conversation.