

The chart below is a way to visualize real GDP change since 2007. It uses a stacked column chart to segment the four major components of GDP with a dashed line overlay to show the sum of the four, which is real GDP itself. Here is the latest overview from the Bureau of Labor Statistics:
Real gross domestic product (GDP) increased at an annual rate of 4.2 percent in the second quarter of 2018 (table 1), according to the "second" estimate released by the Bureau of Economic Analysis. In the first quarter, real GDP increased 2.2 percent.
The GDP estimate released today is based on more complete source data than were available for the "advance" estimate issued last month. In the advance estimate, the increase in real GDP was 4.1 percent. With this second estimate for the second quarter, the general picture of economic growth remains the same; the revision primarily reflected upward revisions to nonresidential fixed investment and private inventory investment that were partly offset by a downward revision to personal consumption expenditures (PCE). Imports which are a subtraction in the calculation of GDP, were revised down. (see "Updates to GDP" on page 2). [more here]
Let's take a closer look at the contributions of GDP of the four major subcomponents. The data source for this chart is the Excel file accompanying the BEA's latest GDP news release(see the links in the right column). Specifically, it uses Table 2: Contributions to Percent Change in Real Gross Domestic Product.
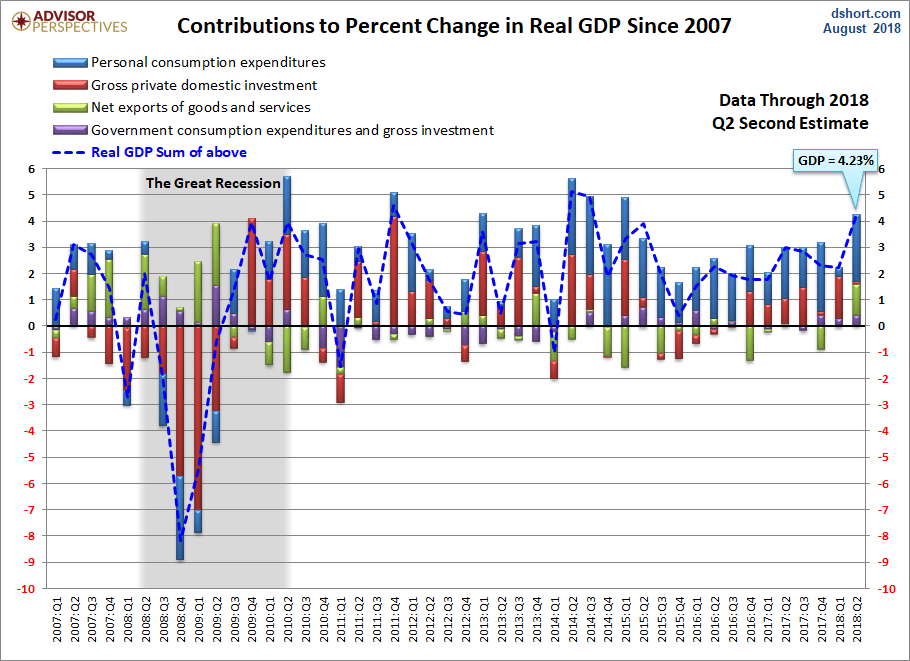
Note: The conventional practice is to round GDP to one decimal place, the latest at 4.2%. The GDP in the chart above is the real GDP calculated to two decimal places.
Here is a chart of the latest estimates.
Over the time frame of this chart, the Personal Consumption Expenditures (PCE) component has shown the most consistent correlation with real GDP itself. When PCE has been positive, GDP has usually been positive, and vice versa. In the latest GDP data, the contribution of PCE came at 2.55 of the 4.23 real GDP, up from the previous revision and still a positive contribution to Q2 GDP.
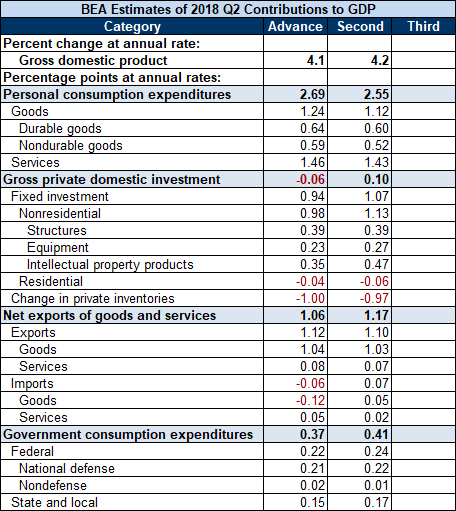
Gross Private Domestic Investment was a small, but positive contributor.
Net Exports were positive in Q2.
Government Consumption Expenditures came in as a positive contributor.
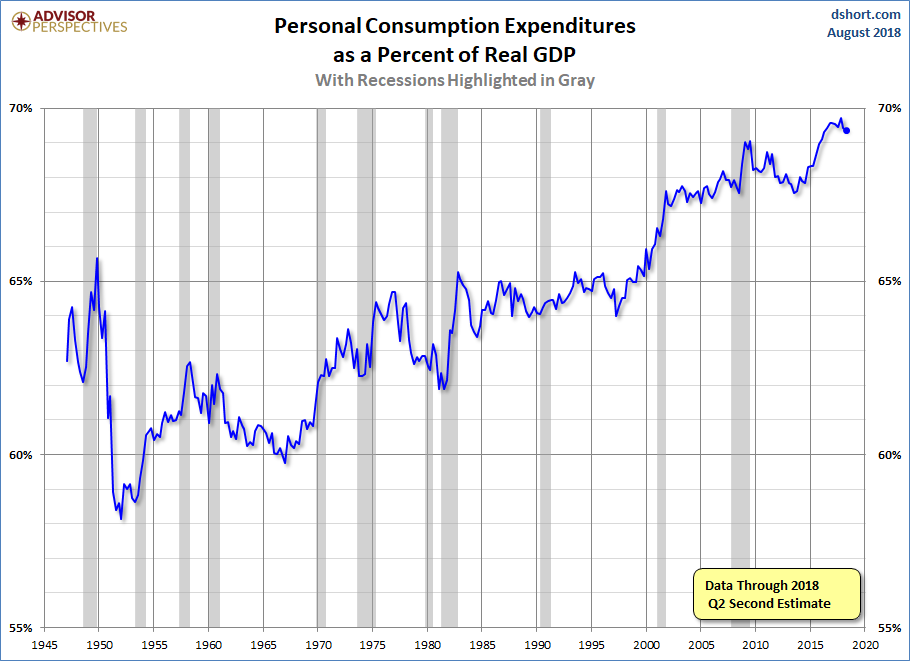
As for the role of Personal Consumption Expenditures (PCE) in GDP and how it has increased over time, here is a snapshot of the PCE-to-GDP ratio since the inception of quarterly GDP in 1947. To one decimal place, the latest ratio of 69.4% is just below its record high.
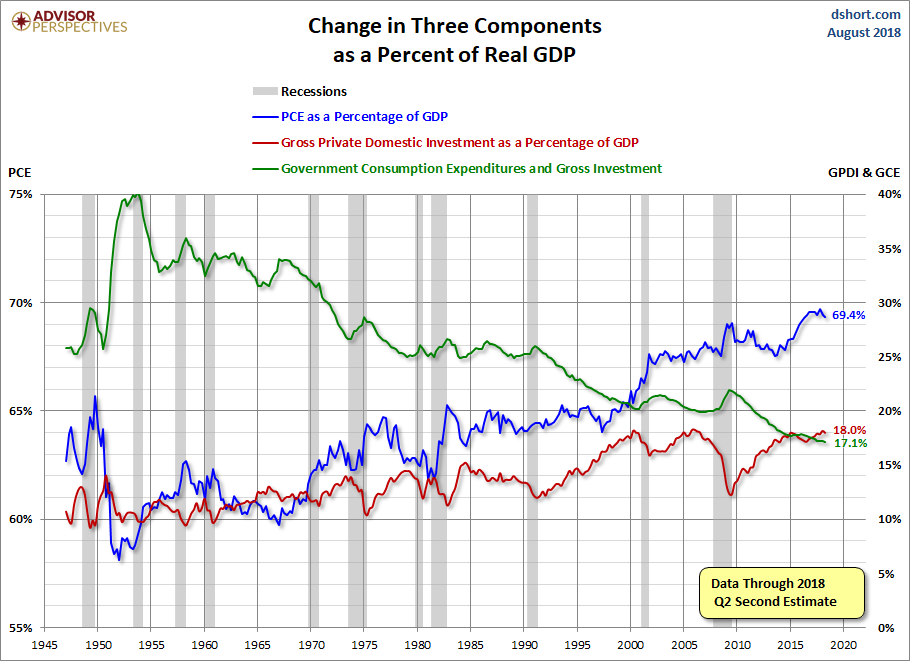
Let's close with a look at the inverse behavior of three of the GPDI components during recessions. PCE and especially GC generally increase as a percent of GDP whereas GPDI declines. Note the three with different vertical axes (Personal Consumption Expenditures on the left, Gross Private Domestic Investment and Government Consumption on the right) to highlight the frequent inverse correlations.
Note: The charts in this commentary have been updated to include the Q2 2018 Second Estimate released yesterday morning.



Comments
Log in or sign up to join the conversation.