

For today's edition of our upgrade list, we used our website's advanced screening functions to search for UPGRADES to BUY or STRONG BUY with complete forecast and valuation data. They are presented by one-month forecast return. Colony NorthStar, Embraer, and DXC Tech are STRONG BUY stocks. Marcus and Millichap and Party City are rated BUY.
|
Ticker |
Company Name |
Market Price |
Valuation |
Last 12-M Return |
1-M Forecast Return |
1-Yr Forecast Return |
P/E Ratio |
Sector Name |
|
CLNS |
COLONY NORTHSTR |
5.98 |
299.23% |
-53.93% |
1.54% |
18.51% |
6.08 |
Finance |
|
ERJ |
EMBRAER AIR-ADR |
27.18 |
47.55% |
13.25% |
1.13% |
13.51% |
16.86 |
Aerospace |
|
DXC |
DXC TECHNOLOGY |
106.72 |
14.95% |
54.67% |
1.10% |
13.23% |
14.19 |
Computer and Technology |
|
MMI |
MARCUS&MILLICHP |
35.85 |
22.56% |
36.36% |
0.70% |
8.41% |
21.99 |
Finance |
|
PRTY |
PARTY CITY HOCO |
15.65 |
1.53% |
9.06% |
0.60% |
7.25% |
12.42 |
Consumer Discretionary |
For today's bulletin, we take a look at DXC Technology (DXC). DXC Technology Co. is an IT services company. It services include Analytics, Application, Business Process, Cloud, Consulting, Enterprise and Cloud Applications, Security, Workplace and Mobility and Industries. DXC Technology Company, formerly known as DAX Technology, is headquartered in Tysons, Virginia.
This stock has a good record of performance over the past year or so. The stock is at-or-near its 52-week high, and they have posted a positive earnings surprise for the past four quarters. When they reported earnings last month, they showed $2.15/share, which was a nice beat over the consensus estimate of $1.99/share. At that time, they also showed revenues of $6.1 billion--which had grown a massive 223% year-over-year.
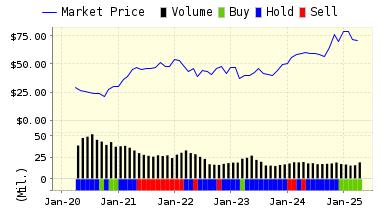
Below is our latest data for DXC Technology, one of our top STRONG BUY upgrades for the day.
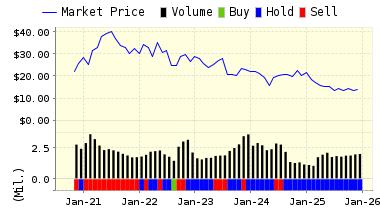
ValuEngine updated its recommendation from BUY to STRONG BUY for American Eagle Outfitters on 2018-03-02. Based on the information we have gathered and our resulting research, we feel that American Eagle Outfitters has the probability to OUTPERFORM average market performance for the next year. The company exhibits ATTRACTIVE Momentum and Company Size.
|
ValuEngine Forecast |
||
|
Target |
Expected |
|
|---|---|---|
|
1-Month |
107.90 | 1.10% |
|
3-Month |
107.96 | 1.16% |
|
6-Month |
111.02 | 4.03% |
|
1-Year |
120.84 | 13.23% |
|
2-Year |
126.22 | 18.28% |
|
3-Year |
129.21 | 21.07% |
|
Valuation & Rankings |
|||
|
Valuation |
14.95% overvalued |
Valuation Rank(?) |
 30 30 |
|
1-M Forecast Return |
1.10% |
1-M Forecast Return Rank |
99 |
|
12-M Return |
54.67% |
Momentum Rank(?) |
89 |
|
Sharpe Ratio |
0.35 |
Sharpe Ratio Rank(?) |
69 |
|
5-Y Avg Annual Return |
15.29% |
5-Y Avg Annual Rtn Rank |
81 |
|
Volatility |
43.25% |
Volatility Rank(?) |
38 |
|
Expected EPS Growth |
18.88% |
EPS Growth Rank(?) |
47 |
|
Market Cap (billions) |
15.07 |
Size Rank |
92 |
|
Trailing P/E Ratio |
14.19 |
Trailing P/E Rank(?) |
81 |
|
Forward P/E Ratio |
11.94 |
Forward P/E Ratio Rank |
74 |
|
PEG Ratio |
0.75 |
PEG Ratio Rank |
48 |
|
Price/Sales |
0.75 |
Price/Sales Rank(?) |
77 |
|
Market/Book |
1.14 |
Market/Book Rank(?) |
77 |
|
Beta |
1.04 |
Beta Rank |
37 |
|
Alpha |
0.25 |
Alpha Rank |
87 |
Comments
Log in or sign up to join the conversation.